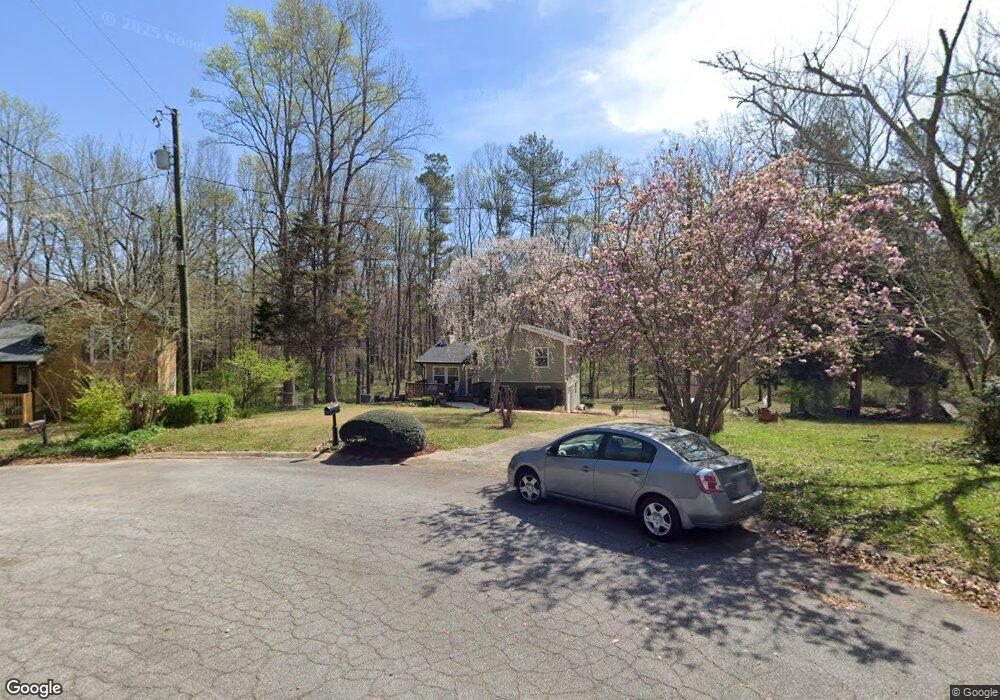
1854 Juniper Ct SW Marietta, GA 30008
Southwestern Marietta NeighborhoodEstimated Value: $275,762 - $289,000
4
Beds
2
Baths
964
Sq Ft
$290/Sq Ft
Est. Value
About This Home
This home is located at 1854 Juniper Ct SW, Marietta, GA 30008 and is currently estimated at $279,441, approximately $289 per square foot. 1854 Juniper Ct SW is a home located in Cobb County with nearby schools including Hollydale Elementary School, Smitha Middle School, and Osborne High School.
Ownership History
Date
Name
Owned For
Owner Type
Purchase Details
Closed on
Apr 22, 2019
Sold by
Simon John Henry
Bought by
Mathis-Simon Mary Jean
Current Estimated Value
Purchase Details
Closed on
Mar 25, 2019
Sold by
Simon Mary A Estate
Bought by
Mathis-Simon Mary J and Simon John H
Purchase Details
Closed on
Nov 12, 1999
Sold by
Gregson Michael and Gregson Rhonda
Bought by
Simon Mary A
Home Financials for this Owner
Home Financials are based on the most recent Mortgage that was taken out on this home.
Original Mortgage
$94,000
Interest Rate
7.94%
Mortgage Type
FHA
Purchase Details
Closed on
Oct 20, 1995
Sold by
Baldwin Ernest J Annette O
Bought by
Gregson Michael Rhonda
Purchase Details
Closed on
Nov 29, 1994
Sold by
Willingham Harold S
Bought by
Baldwin Ernest J Annette
Create a Home Valuation Report for This Property
The Home Valuation Report is an in-depth analysis detailing your home's value as well as a comparison with similar homes in the area
Home Values in the Area
Average Home Value in this Area
Purchase History
| Date | Buyer | Sale Price | Title Company |
|---|---|---|---|
| Mathis-Simon Mary Jean | -- | -- | |
| Mathis-Simon Mary J | -- | -- | |
| Simon Mary A | $95,000 | -- | |
| Gregson Michael Rhonda | $23,000 | -- | |
| Baldwin Ernest J Annette | $57,500 | -- |
Source: Public Records
Mortgage History
| Date | Status | Borrower | Loan Amount |
|---|---|---|---|
| Previous Owner | Simon Mary A | $94,000 | |
| Closed | Baldwin Ernest J Annette | -- |
Source: Public Records
Tax History Compared to Growth
Tax History
| Year | Tax Paid | Tax Assessment Tax Assessment Total Assessment is a certain percentage of the fair market value that is determined by local assessors to be the total taxable value of land and additions on the property. | Land | Improvement |
|---|---|---|---|---|
| 2025 | $739 | $97,456 | $30,000 | $67,456 |
| 2024 | $740 | $97,456 | $30,000 | $67,456 |
| 2023 | $520 | $92,604 | $20,000 | $72,604 |
| 2022 | $547 | $63,080 | $14,000 | $49,080 |
| 2021 | $547 | $63,080 | $14,000 | $49,080 |
| 2020 | $515 | $52,348 | $14,000 | $38,348 |
| 2019 | $1,141 | $52,348 | $14,000 | $38,348 |
| 2018 | $933 | $42,848 | $11,200 | $31,648 |
| 2017 | $900 | $42,848 | $11,200 | $31,648 |
| 2016 | $634 | $30,928 | $11,200 | $19,728 |
| 2015 | $651 | $30,928 | $11,200 | $19,728 |
| 2014 | $460 | $24,312 | $0 | $0 |
Source: Public Records
Map
Nearby Homes
- 0 Burfordi Dr SW Unit 7658493
- 0 Burfordi Dr SW Unit 10637361
- 3055 Milford Chase Overlook SW
- 3145 Fern Valley Dr SW
- 2700 Flintlock Ln SW
- 1697 Rustic Dr SW
- 3106 Sasanqua Ln SW
- 3000 Fern Valley Dr SW
- 2060 Powder Springs Rd SW
- 1719 Silverchase Dr SW
- 3123 Milford Chase SW
- 2099 Redbud Ct SW
- 1970 Powder Springs Rd SW
- 1618 Sparrow Wood Ln SW
- 3075 Milford Chase SW
- 1613 Sparrow Wood Ln SW Unit 3
- 1559 Woodmore Dr SW
- 3340 Vineland Dr SW
- 2318 Powder Springs Rd SW
- 1855 Juniper Ct SW
- 1844 Juniper Ct SW
- 1845 Juniper Ct SW
- 1834 Juniper Ct SW
- 3226 Fern Valley Dr SW Unit 3
- 1835 Juniper Ct SW
- 3222 Fern Valley Dr SW
- 3244 Fern Valley Dr SW
- 1832 Hetz Ct SW
- 3218 Fern Valley Dr SW
- 0 SW Hetz Ct
- 1822 Hetz Ct SW
- 3248 Fern Valley Dr SW
- 3225 Fern Valley Dr SW Unit 3
- 3233 Fern Valley Dr SW
- 3237 Fern Valley Dr SW
- 3221 Fern Valley Dr SW
- 3214 Fern Valley Dr SW
- 3227 Fern Valley Dr SW
- 3229 Fern Valley Dr SW