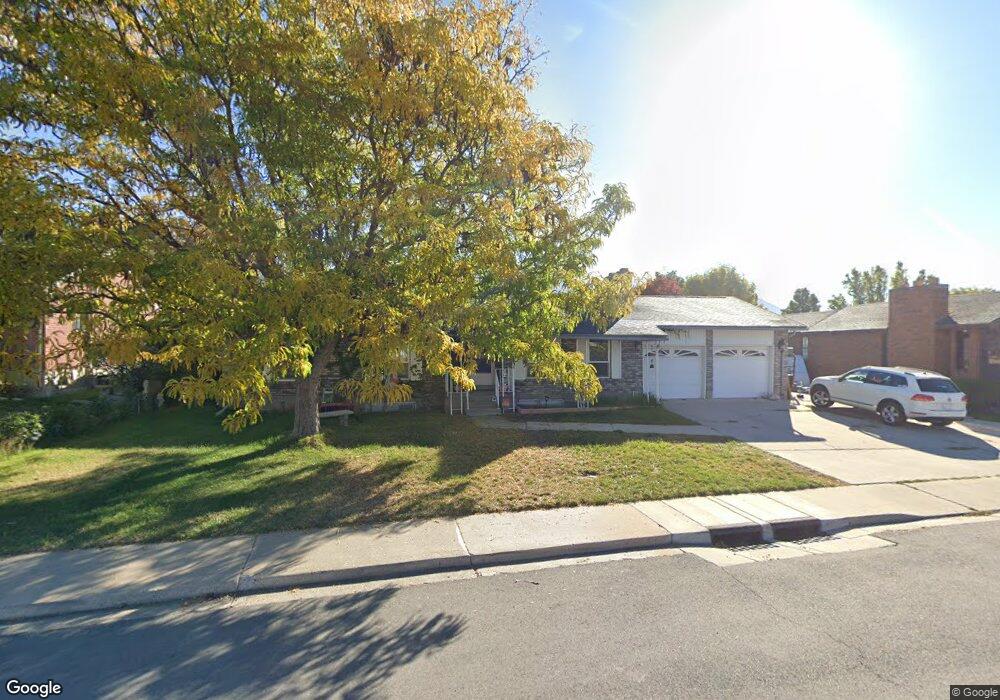
1854 N 2100 W Provo, UT 84604
Grandview North NeighborhoodEstimated Value: $572,000 - $668,000
5
Beds
3
Baths
2,652
Sq Ft
$235/Sq Ft
Est. Value
About This Home
This home is located at 1854 N 2100 W, Provo, UT 84604 and is currently estimated at $623,541, approximately $235 per square foot. 1854 N 2100 W is a home located in Utah County with nearby schools including Westridge Elementary School, Dixon Middle School, and Provo High School.
Ownership History
Date
Name
Owned For
Owner Type
Purchase Details
Closed on
Apr 8, 2024
Sold by
Buhler Kyle R and Buhler Tory
Bought by
Finch Travis James and Finch Taylor N
Current Estimated Value
Home Financials for this Owner
Home Financials are based on the most recent Mortgage that was taken out on this home.
Original Mortgage
$472,000
Outstanding Balance
$464,974
Interest Rate
6.9%
Mortgage Type
New Conventional
Estimated Equity
$158,567
Purchase Details
Closed on
Feb 23, 2018
Sold by
Buhler Kyle R
Bought by
Buhler Kyle R and Buhler Tory
Home Financials for this Owner
Home Financials are based on the most recent Mortgage that was taken out on this home.
Original Mortgage
$300,700
Interest Rate
3.99%
Mortgage Type
New Conventional
Purchase Details
Closed on
Jan 29, 2016
Sold by
Rasband Rasband J and Rasband Fern C
Bought by
Theobald Rasband J and Theobald Nanette
Create a Home Valuation Report for This Property
The Home Valuation Report is an in-depth analysis detailing your home's value as well as a comparison with similar homes in the area
Home Values in the Area
Average Home Value in this Area
Purchase History
| Date | Buyer | Sale Price | Title Company |
|---|---|---|---|
| Finch Travis James | -- | First American Title Insurance | |
| Buhler Kyle R | -- | Accommodation | |
| Buhler Kyle R | -- | Gt Title Services | |
| Theobald Rasband J | -- | None Available |
Source: Public Records
Mortgage History
| Date | Status | Borrower | Loan Amount |
|---|---|---|---|
| Open | Finch Travis James | $472,000 | |
| Previous Owner | Buhler Kyle R | $300,700 |
Source: Public Records
Tax History Compared to Growth
Tax History
| Year | Tax Paid | Tax Assessment Tax Assessment Total Assessment is a certain percentage of the fair market value that is determined by local assessors to be the total taxable value of land and additions on the property. | Land | Improvement |
|---|---|---|---|---|
| 2025 | $2,688 | $326,260 | $191,500 | $401,700 |
| 2024 | $2,688 | $264,550 | $0 | $0 |
| 2023 | $2,683 | $260,370 | $0 | $0 |
| 2022 | $2,764 | $270,490 | $0 | $0 |
| 2021 | $2,038 | $347,800 | $108,000 | $239,800 |
| 2020 | $1,964 | $314,200 | $98,200 | $216,000 |
| 2019 | $1,878 | $312,400 | $98,200 | $214,200 |
| 2018 | $1,635 | $275,900 | $89,600 | $186,300 |
| 2017 | $1,582 | $146,685 | $0 | $0 |
| 2016 | $1,576 | $136,180 | $0 | $0 |
| 2015 | $1,559 | $136,180 | $0 | $0 |
| 2014 | $1,341 | $122,100 | $0 | $0 |
Source: Public Records
Map
Nearby Homes