Estimated Value: $272,000 - $315,000
4
Beds
3
Baths
1,779
Sq Ft
$162/Sq Ft
Est. Value
About This Home
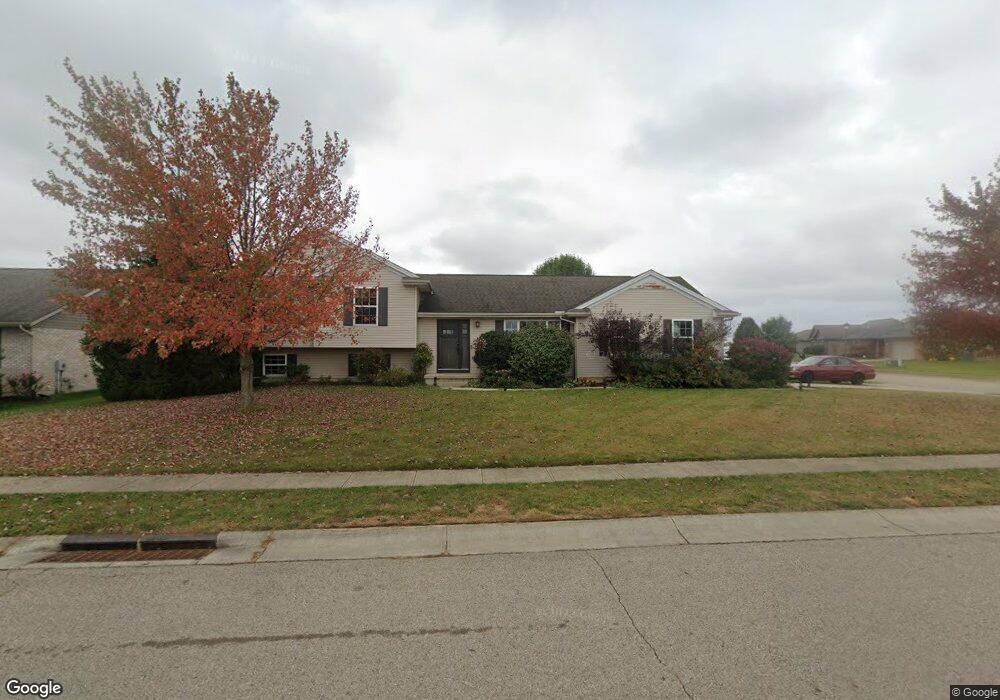
This home is located at 1854 Promenade Ln, Xenia, OH 45385 and is currently estimated at $289,057, approximately $162 per square foot. 1854 Promenade Ln is a home located in Greene County with nearby schools including Xenia High School, Summit Academy Community School for Alternative Learners - Xenia, and Legacy Christian Academy.
Ownership History
Date
Name
Owned For
Owner Type
Purchase Details
Closed on
Feb 22, 2021
Sold by
Brock Brian D and Brock Kristy E
Bought by
Brock Kristy E
Current Estimated Value
Home Financials for this Owner
Home Financials are based on the most recent Mortgage that was taken out on this home.
Original Mortgage
$172,410
Outstanding Balance
$154,202
Interest Rate
2.7%
Mortgage Type
FHA
Estimated Equity
$134,855
Purchase Details
Closed on
May 7, 2010
Sold by
Blair Melissa M and Beard Melissa M
Bought by
Brock Brian D and Brock Kristy E
Home Financials for this Owner
Home Financials are based on the most recent Mortgage that was taken out on this home.
Original Mortgage
$167,641
Interest Rate
5.25%
Mortgage Type
FHA
Purchase Details
Closed on
Jul 27, 2005
Sold by
Rowland John E and Rowland Patricia L
Bought by
Beard Melissa M
Home Financials for this Owner
Home Financials are based on the most recent Mortgage that was taken out on this home.
Original Mortgage
$163,500
Interest Rate
5.71%
Mortgage Type
Construction
Create a Home Valuation Report for This Property
The Home Valuation Report is an in-depth analysis detailing your home's value as well as a comparison with similar homes in the area
Home Values in the Area
Average Home Value in this Area
Purchase History
| Date | Buyer | Sale Price | Title Company |
|---|---|---|---|
| Brock Kristy E | -- | Surety Lender Services Llc | |
| Brock Brian D | $169,900 | Midwest Title Company | |
| Beard Melissa M | $39,000 | Commerce Title Company |
Source: Public Records
Mortgage History
| Date | Status | Borrower | Loan Amount |
|---|---|---|---|
| Open | Brock Kristy E | $172,410 | |
| Closed | Brock Brian D | $167,641 | |
| Previous Owner | Beard Melissa M | $163,500 |
Source: Public Records
Tax History Compared to Growth
Tax History
| Year | Tax Paid | Tax Assessment Tax Assessment Total Assessment is a certain percentage of the fair market value that is determined by local assessors to be the total taxable value of land and additions on the property. | Land | Improvement |
|---|---|---|---|---|
| 2024 | $3,170 | $74,080 | $17,300 | $56,780 |
| 2023 | $3,170 | $74,080 | $17,300 | $56,780 |
| 2022 | $2,922 | $58,240 | $13,310 | $44,930 |
| 2021 | $2,961 | $58,240 | $13,310 | $44,930 |
| 2020 | $2,837 | $58,240 | $13,310 | $44,930 |
| 2019 | $2,869 | $55,440 | $13,870 | $41,570 |
| 2018 | $2,880 | $55,440 | $13,870 | $41,570 |
| 2017 | $2,834 | $55,440 | $13,870 | $41,570 |
| 2016 | $2,834 | $53,540 | $13,870 | $39,670 |
| 2015 | $2,842 | $53,540 | $13,870 | $39,670 |
| 2014 | $2,721 | $53,540 | $13,870 | $39,670 |
Source: Public Records
Map
Nearby Homes
- 1872 Harris Ln
- 1815 Promenade Ln
- 493 Hollywood Blvd
- 499 Hollywood Blvd
- 1820 Palmer Ct
- 1814 Palmer Ct
- 1808 Palmer Ct
- 1968 El Camino Dr
- 1802 Palmer Ct
- 1791 Palmer Ct
- 1796 Palmer Ct
- 517 Hollywood Blvd
- 523 Hollywood Blvd
- 532 Hollywood Blvd
- 2094 Malibu Trail
- Harmony Plan at Grandstone Trace
- Newcastle Plan at Grandstone Trace
- Pendleton Plan at Grandstone Trace
- Bellamy Plan at Grandstone Trace
- Chatham Plan at Grandstone Trace
- 1844 Promenade Ln
- 2219 Carousel Dr
- 1857 Promenade Ln
- 1855 Promenade Ln
- 2216 Carousel Dr
- 2223 Carousel Dr
- 1836 Promenade Ln
- 1847 Promenade Ln
- 1863 Promenade Ln
- 2220 Carousel Dr
- 1839 Promenade Ln
- 1871 Promenade Ln
- 2231 Carousel Dr
- 2228 Carousel Dr
- 1828 Promenade Ln
- 1880 Promenade Ln
- 1831 Promenade Ln
- 1881 Promenade Ln
- 2236 Carousel Dr
- 1868 Harris Ln