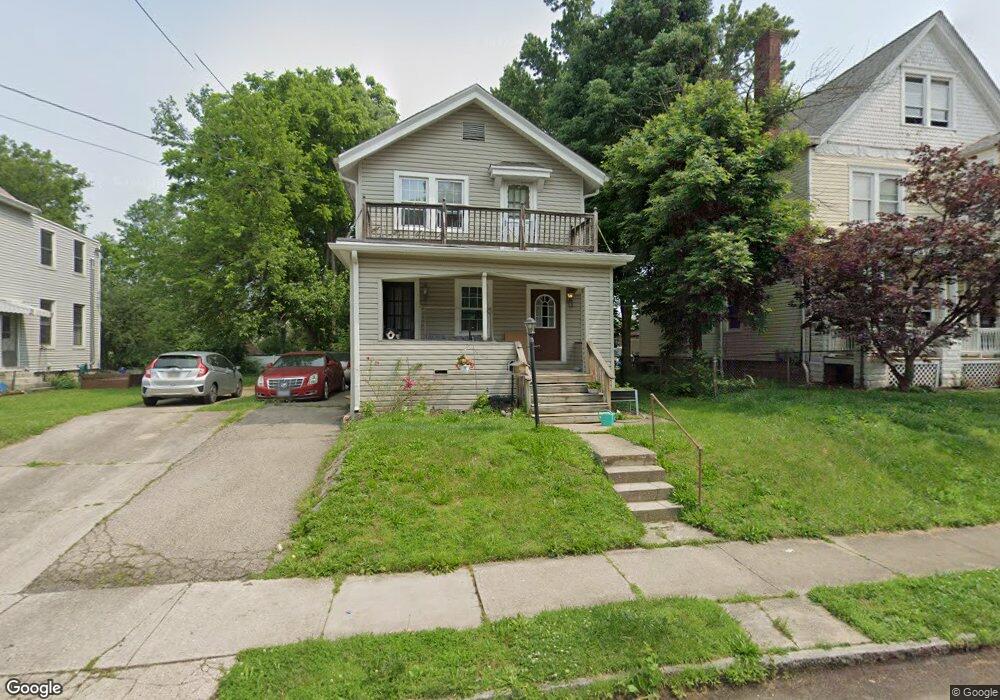
1854 Tilden Ave Cincinnati, OH 45212
Estimated Value: $185,679 - $258,000
3
Beds
2
Baths
1,640
Sq Ft
$136/Sq Ft
Est. Value
About This Home
This home is located at 1854 Tilden Ave, Cincinnati, OH 45212 and is currently estimated at $223,170, approximately $136 per square foot. 1854 Tilden Ave is a home located in Hamilton County with nearby schools including Norwood High School, Cornerstone Christian Academy, and Immaculate Conception Academy.
Ownership History
Date
Name
Owned For
Owner Type
Purchase Details
Closed on
Dec 10, 2019
Sold by
Shen Jessie
Bought by
As Capital Llc
Current Estimated Value
Purchase Details
Closed on
Jan 1, 2019
Sold by
Shen Yuee and Zuo Dayu
Bought by
Shen Jessie
Purchase Details
Closed on
Apr 9, 2009
Sold by
Secretary Of Housing & Urban Development
Bought by
Shen Yuee
Purchase Details
Closed on
Aug 26, 2008
Sold by
Phillips Loretta A and Phillips Audie Alan
Bought by
Secretary Of Housing & Urban Development
Purchase Details
Closed on
Jun 7, 1999
Sold by
Gibson Larry L and Gibson Vickie
Bought by
Phillips Loretta A
Home Financials for this Owner
Home Financials are based on the most recent Mortgage that was taken out on this home.
Original Mortgage
$90,491
Interest Rate
6.99%
Mortgage Type
FHA
Create a Home Valuation Report for This Property
The Home Valuation Report is an in-depth analysis detailing your home's value as well as a comparison with similar homes in the area
Home Values in the Area
Average Home Value in this Area
Purchase History
| Date | Buyer | Sale Price | Title Company |
|---|---|---|---|
| As Capital Llc | -- | None Available | |
| Shen Jessie | -- | None Available | |
| Shen Yuee | $31,500 | Lakeside Title & Escrow Agen | |
| Secretary Of Housing & Urban Development | $66,000 | None Available | |
| Phillips Loretta A | $92,700 | -- |
Source: Public Records
Mortgage History
| Date | Status | Borrower | Loan Amount |
|---|---|---|---|
| Previous Owner | Phillips Loretta A | $90,491 |
Source: Public Records
Tax History
| Year | Tax Paid | Tax Assessment Tax Assessment Total Assessment is a certain percentage of the fair market value that is determined by local assessors to be the total taxable value of land and additions on the property. | Land | Improvement |
|---|---|---|---|---|
| 2025 | $2,371 | $44,391 | $10,220 | $34,171 |
| 2023 | $2,770 | $51,601 | $10,220 | $41,381 |
| 2022 | $1,656 | $25,929 | $6,864 | $19,065 |
| 2021 | $1,635 | $25,929 | $6,864 | $19,065 |
| 2020 | $1,599 | $25,929 | $6,864 | $19,065 |
| 2019 | $1,486 | $22,743 | $6,020 | $16,723 |
| 2018 | $1,487 | $22,743 | $6,020 | $16,723 |
| 2017 | $1,410 | $22,743 | $6,020 | $16,723 |
| 2016 | $677 | $10,364 | $5,660 | $4,704 |
| 2015 | $596 | $10,364 | $5,660 | $4,704 |
| 2014 | $600 | $10,364 | $5,660 | $4,704 |
| 2013 | $631 | $11,025 | $6,020 | $5,005 |
Source: Public Records
Map
Nearby Homes
- 1901 Sherman Ave
- 1846 Cleveland Ave
- 1762 Cleveland Ave
- 1841 Mills Ave
- 4719 Section Ave
- 1827 Maple Ave
- 1952 Maple Ave
- 1819 Maple Ave
- 1907 Crown Ave
- 1824 Maple Ave
- 2005 Crown Ave
- 2030 Elm Ave
- 2043 Lawrence Ave
- 2049 Sherman Ave
- 1701 Sherman Ave
- 4308 Carter Ave
- 2053 Foraker Ave
- 3 Baker Cir
- 2010 Hopkins Ave
- 4210 Lowry Ave
Your Personal Tour Guide
Ask me questions while you tour the home.