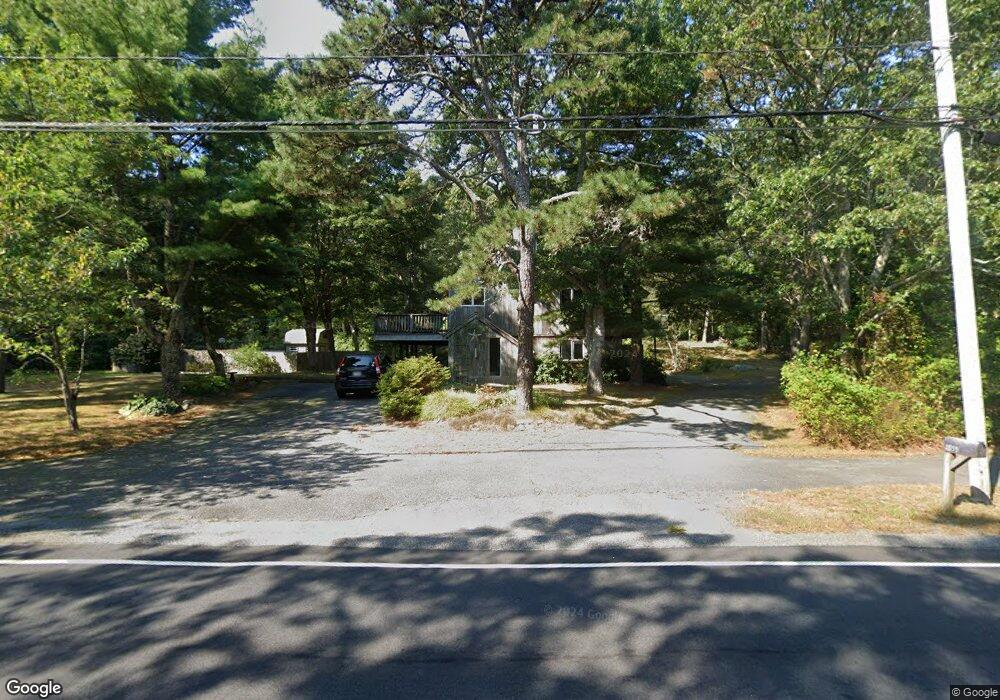
1855 Old Stage Rd West Barnstable, MA 02668
West Barnstable NeighborhoodEstimated Value: $628,000 - $686,000
5
Beds
3
Baths
1,258
Sq Ft
$531/Sq Ft
Est. Value
About This Home
This home is located at 1855 Old Stage Rd, West Barnstable, MA 02668 and is currently estimated at $668,206, approximately $531 per square foot. 1855 Old Stage Rd is a home located in Barnstable County with nearby schools including West Barnstable Elementary School, Barnstable United Elementary School, and Barnstable Intermediate School.
Ownership History
Date
Name
Owned For
Owner Type
Purchase Details
Closed on
May 29, 2012
Sold by
Ingraham David and Ingraham Nanette
Bought by
Ingraham David A and Ingraham Nanette M
Current Estimated Value
Home Financials for this Owner
Home Financials are based on the most recent Mortgage that was taken out on this home.
Original Mortgage
$269,810
Outstanding Balance
$115,137
Interest Rate
3.88%
Mortgage Type
New Conventional
Estimated Equity
$553,069
Purchase Details
Closed on
May 20, 2003
Sold by
Theodore Christopher L and Theodore Gwenne T
Bought by
Ingraham David and Ingraham Nanette
Home Financials for this Owner
Home Financials are based on the most recent Mortgage that was taken out on this home.
Original Mortgage
$313,025
Interest Rate
5.84%
Mortgage Type
Purchase Money Mortgage
Purchase Details
Closed on
Mar 12, 1999
Sold by
Int Viola C Johnson and Johnson Philip
Bought by
Theodore Christopher and Theodore Gwenne T
Purchase Details
Closed on
Jun 17, 1996
Sold by
Ahern Brian M and Ahern Carolyn M
Bought by
Johnson Viola C
Create a Home Valuation Report for This Property
The Home Valuation Report is an in-depth analysis detailing your home's value as well as a comparison with similar homes in the area
Home Values in the Area
Average Home Value in this Area
Purchase History
| Date | Buyer | Sale Price | Title Company |
|---|---|---|---|
| Ingraham David A | -- | -- | |
| Ingraham David | $329,500 | -- | |
| Theodore Christopher | $155,000 | -- | |
| Johnson Viola C | $151,000 | -- |
Source: Public Records
Mortgage History
| Date | Status | Borrower | Loan Amount |
|---|---|---|---|
| Open | Ingraham David A | $269,810 | |
| Previous Owner | Johnson Viola C | $313,025 | |
| Previous Owner | Johnson Viola C | $128,000 | |
| Previous Owner | Johnson Viola C | $49,500 |
Source: Public Records
Tax History
| Year | Tax Paid | Tax Assessment Tax Assessment Total Assessment is a certain percentage of the fair market value that is determined by local assessors to be the total taxable value of land and additions on the property. | Land | Improvement |
|---|---|---|---|---|
| 2025 | $4,668 | $499,800 | $176,900 | $322,900 |
| 2024 | $4,394 | $512,100 | $176,900 | $335,200 |
| 2023 | $3,967 | $435,500 | $160,900 | $274,600 |
| 2022 | $4,223 | $380,100 | $119,400 | $260,700 |
| 2021 | $4,128 | $352,200 | $119,400 | $232,800 |
| 2020 | $4,097 | $338,000 | $127,100 | $210,900 |
| 2019 | $3,737 | $304,300 | $127,100 | $177,200 |
| 2018 | $3,966 | $320,100 | $133,800 | $186,300 |
| 2017 | $3,840 | $313,700 | $133,800 | $179,900 |
| 2016 | $3,801 | $317,000 | $137,100 | $179,900 |
| 2015 | $3,665 | $306,400 | $128,100 | $178,300 |
Source: Public Records
Map
Nearby Homes
- 50 Currycomb Cir
- 84 White Birch Way
- 74 Saddler Ln
- 282 Parker Rd
- 120 Great Hill Dr
- 80 Branch Terrace
- 1044 Old Falmouth Rd
- 1028 Old Falmouth Rd
- 324 Patriot Way
- 62 Three Ponds Dr
- 32 Willington Ave
- 87 Foxglove Rd
- 90 Guildford Rd
- 169 Cedric Rd
- 510 Cedar St
- 900 Old Stage Rd
- 75 Old Toll Rd
- 315 Prince Hinckley Rd
- 66 Tern Ln
- 296 Buckskin Path
- 1881 Old Stage Rd
- 1845 Old Stage Rd
- 6 Judys Ln
- 2362 Old Stage Rd
- 1135 Service Rd
- 1825 Old Stage Rd
- 1125 Service Rd
- 1815 Old Stage Rd
- 398 Woodside Rd
- 376 Woodside Rd
- 1800 Old Stage Rd
- 1784 Old Stage Rd
- 1095 Service Rd
- 240 The Plains Rd
- 1770 Old Stage Rd
- 389 Woodside Rd
- 361 Woodside Rd
- 1065 Service Rd
- 360 Woodside Rd
- 90 Pine St
Your Personal Tour Guide
Ask me questions while you tour the home.