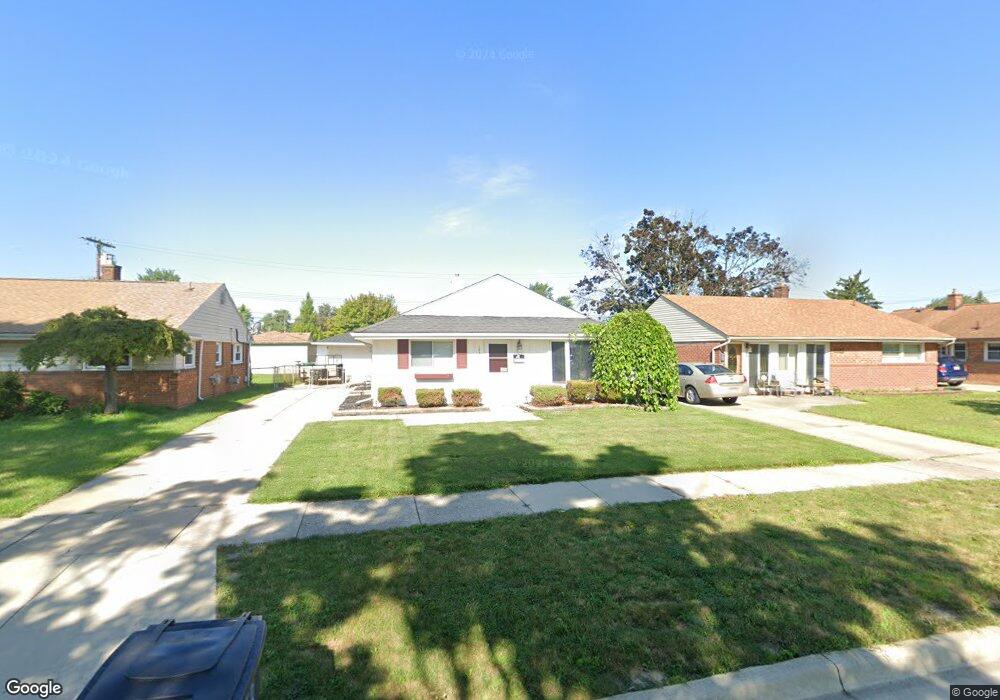
18550 Marsha St Riverview, MI 48193
Estimated Value: $157,067 - $186,000
--
Bed
--
Bath
1,036
Sq Ft
$169/Sq Ft
Est. Value
About This Home
This home is located at 18550 Marsha St, Riverview, MI 48193 and is currently estimated at $175,517, approximately $169 per square foot. 18550 Marsha St is a home located in Wayne County with nearby schools including Riverview Community High School and St. Cyprian Elementary School.
Ownership History
Date
Name
Owned For
Owner Type
Purchase Details
Closed on
Feb 15, 2012
Sold by
Hunter Gregory D
Bought by
Hunter Gregory D and Hunter Stacie
Current Estimated Value
Home Financials for this Owner
Home Financials are based on the most recent Mortgage that was taken out on this home.
Original Mortgage
$111,082
Outstanding Balance
$76,936
Interest Rate
4.12%
Mortgage Type
FHA
Estimated Equity
$98,581
Purchase Details
Closed on
Dec 20, 2007
Sold by
Haase Rebecca K and Hunter Gregory D
Bought by
Hunter Gregory D
Purchase Details
Closed on
Jul 14, 2003
Sold by
Sanfilippo Dominic A and Sanfilippo Christine Crawford
Bought by
Finnerty Rebecca K
Purchase Details
Closed on
Jun 28, 2000
Sold by
Pittiglio Karen L
Bought by
Sanfilippo Dominic A
Purchase Details
Closed on
Apr 7, 1998
Sold by
Lynnette Olszews Kevin and Lynnette Olszews
Bought by
Pittiglio Karen L
Purchase Details
Closed on
Nov 28, 1994
Sold by
Wilding Richard L
Bought by
Kevin Olszewski
Create a Home Valuation Report for This Property
The Home Valuation Report is an in-depth analysis detailing your home's value as well as a comparison with similar homes in the area
Home Values in the Area
Average Home Value in this Area
Purchase History
| Date | Buyer | Sale Price | Title Company |
|---|---|---|---|
| Hunter Gregory D | -- | None Available | |
| Hunter Gregory D | -- | Multiple | |
| Finnerty Rebecca K | $125,000 | Michigan Title Insurance Age | |
| Sanfilippo Dominic A | $105,000 | -- | |
| Pittiglio Karen L | $89,900 | -- | |
| Kevin Olszewski | $78,500 | -- |
Source: Public Records
Mortgage History
| Date | Status | Borrower | Loan Amount |
|---|---|---|---|
| Open | Hunter Gregory D | $111,082 |
Source: Public Records
Tax History Compared to Growth
Tax History
| Year | Tax Paid | Tax Assessment Tax Assessment Total Assessment is a certain percentage of the fair market value that is determined by local assessors to be the total taxable value of land and additions on the property. | Land | Improvement |
|---|---|---|---|---|
| 2025 | $1,991 | $78,500 | $0 | $0 |
| 2024 | $2,056 | $74,800 | $0 | $0 |
| 2023 | $1,880 | $65,100 | $0 | $0 |
| 2022 | $2,742 | $58,000 | $0 | $0 |
| 2021 | $2,594 | $55,700 | $0 | $0 |
| 2020 | $2,563 | $52,400 | $0 | $0 |
| 2019 | $2,516 | $49,000 | $0 | $0 |
| 2018 | $1,547 | $45,400 | $0 | $0 |
| 2017 | $1,592 | $41,300 | $0 | $0 |
| 2016 | $2,253 | $40,400 | $0 | $0 |
| 2015 | $3,375 | $40,400 | $0 | $0 |
| 2013 | $3,270 | $33,300 | $0 | $0 |
| 2012 | $1,714 | $35,800 | $14,300 | $21,500 |
Source: Public Records
Map
Nearby Homes
- VACANT Sibley Rd
- 18552 Hinton St
- 18582 Hamann St
- 18772 Hamann St
- 18616 Koester St
- 12822 Johanna Ct
- 18031 Hamann St
- 18123 Ray St
- 48 Cleveland St
- 54 Cleveland St
- 17788 Quarry St
- 18082 Ray St
- 17748 Reno St
- 214 Detroit St
- 11930 Garfield St
- 259 Detroit St
- 0000 Fort St
- 18765 Riverview St
- 18802 Jefferson
- 0 W Jefferson Ave Unit 20250000763
- 18540 Marsha St
- 18560 Marsha St
- 18530 Marsha St
- 18570 Marsha St
- 18551 Valade St
- 18541 Valade St
- 18561 Valade St
- 18531 Valade St
- 18520 Marsha St
- 18571 Valade St
- 18580 Marsha St
- 18555 Marsha St
- 18545 Marsha St
- 18521 Valade St
- 18565 Marsha St
- 18535 Marsha St
- 18581 Valade St
- 18590 Marsha St
- 18510 Marsha St
- 18575 Marsha St