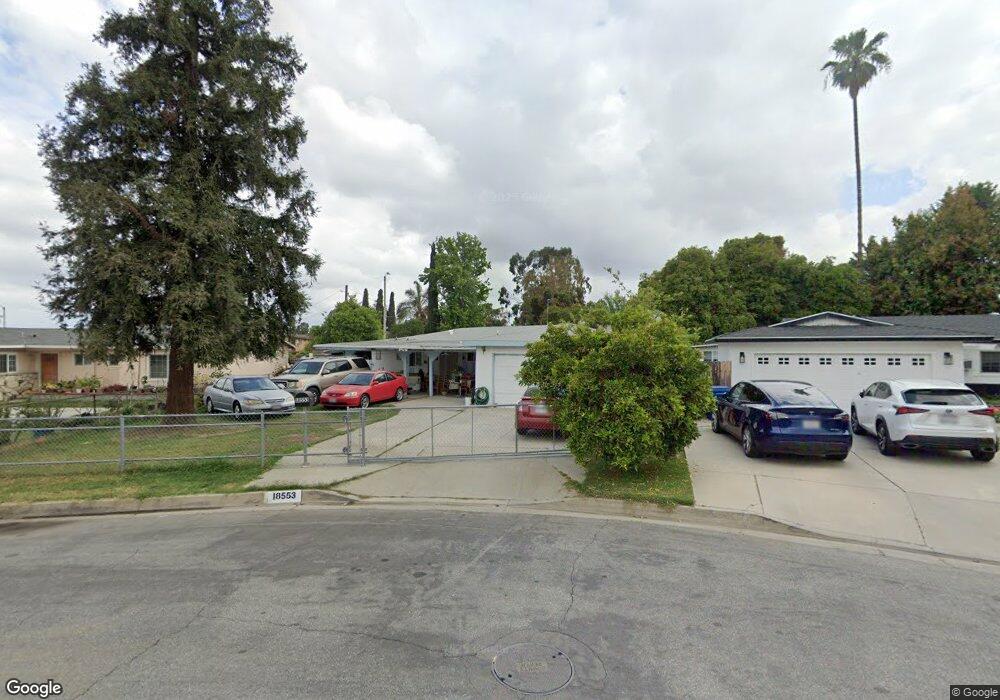
18553 Andrada Dr Rowland Heights, CA 91748
Estimated Value: $699,000 - $804,000
4
Beds
2
Baths
1,175
Sq Ft
$637/Sq Ft
Est. Value
About This Home
This home is located at 18553 Andrada Dr, Rowland Heights, CA 91748 and is currently estimated at $749,048, approximately $637 per square foot. 18553 Andrada Dr is a home located in Los Angeles County with nearby schools including Jellick Elementary School, Alvarado Intermediate School, and John A. Rowland High School.
Ownership History
Date
Name
Owned For
Owner Type
Purchase Details
Closed on
Nov 15, 2023
Sold by
Sandoval Reyes Armando and Sandoval Armando Armando
Bought by
Armando Sandoval Reyes Living Trust and Reyes
Current Estimated Value
Purchase Details
Closed on
Oct 23, 2003
Sold by
Dominguez Olga
Bought by
Sandoval Armando
Home Financials for this Owner
Home Financials are based on the most recent Mortgage that was taken out on this home.
Original Mortgage
$230,400
Interest Rate
5.99%
Mortgage Type
Purchase Money Mortgage
Purchase Details
Closed on
Oct 22, 2003
Sold by
Ouellette Richard and Ouellette Wanda
Bought by
Sandoval Armando
Home Financials for this Owner
Home Financials are based on the most recent Mortgage that was taken out on this home.
Original Mortgage
$230,400
Interest Rate
5.99%
Mortgage Type
Purchase Money Mortgage
Create a Home Valuation Report for This Property
The Home Valuation Report is an in-depth analysis detailing your home's value as well as a comparison with similar homes in the area
Home Values in the Area
Average Home Value in this Area
Purchase History
| Date | Buyer | Sale Price | Title Company |
|---|---|---|---|
| Armando Sandoval Reyes Living Trust | -- | None Listed On Document | |
| Sandoval Armando | -- | Investors Title Company | |
| Sandoval Armando | $288,000 | Investors Title Company |
Source: Public Records
Mortgage History
| Date | Status | Borrower | Loan Amount |
|---|---|---|---|
| Previous Owner | Sandoval Armando | $230,400 | |
| Closed | Sandoval Armando | $57,600 |
Source: Public Records
Tax History Compared to Growth
Tax History
| Year | Tax Paid | Tax Assessment Tax Assessment Total Assessment is a certain percentage of the fair market value that is determined by local assessors to be the total taxable value of land and additions on the property. | Land | Improvement |
|---|---|---|---|---|
| 2025 | $5,263 | $409,453 | $320,889 | $88,564 |
| 2024 | $5,263 | $401,426 | $314,598 | $86,828 |
| 2023 | $5,088 | $393,556 | $308,430 | $85,126 |
| 2022 | $4,974 | $385,840 | $302,383 | $83,457 |
| 2021 | $4,890 | $378,275 | $296,454 | $81,821 |
| 2019 | $4,742 | $367,058 | $287,662 | $79,396 |
| 2018 | $4,523 | $359,862 | $282,022 | $77,840 |
| 2016 | $4,348 | $345,890 | $271,072 | $74,818 |
| 2015 | $4,276 | $340,696 | $267,001 | $73,695 |
| 2014 | $4,268 | $334,023 | $261,771 | $72,252 |
Source: Public Records
Map
Nearby Homes
- 1902 Jellick Ave
- 1537 Greencastle Ave
- 18716 Greengate St
- 2010 La Cueva Dr
- 1334 Felch Ave
- 1441 Paso Real Ave Unit 271
- 1441 Paso Real Ave Unit 316
- 1441 Paso Real Ave Unit 159
- 1441 Paso Real Ave Unit 327
- 1441 Paso Real Ave Unit 37
- 1441 Paso Real Ave
- 1441 Paso Real Ave Unit 72
- 1441 Paso Real Ave Unit 39
- 1441 Paso Real Ave Unit 237
- 1441 Paso Real Ave Unit 186
- 1441 Paso Real Ave Unit 321
- 1441 Paso Real Ave Unit 40
- 1441 Paso Real Ave Unit 283
- 1441 Paso Real Ave Unit 7
- 1441 Paso Real Ave Unit 27
- 1700 Los Padres Dr
- 18547 Andrada Dr
- 1704 Los Padres Dr
- 18541 Andrada Dr
- 1711 Los Padres Dr
- 1710 Los Padres Dr
- 18535 Andrada Dr
- 18544 Andrada Dr
- 18545 Colima Rd Unit C
- 18545 Colima Rd Unit B
- 18545 Colima Rd
- 18538 Andrada Dr
- 1715 Los Padres Dr
- 1716 Los Padres Dr
- 18537 Colima Rd
- 18529 Andrada Dr
- 1716 Santa Ysabela Dr
- 18531 Colima Rd
- 1721 Los Padres Dr
- 1722 Los Padres Dr