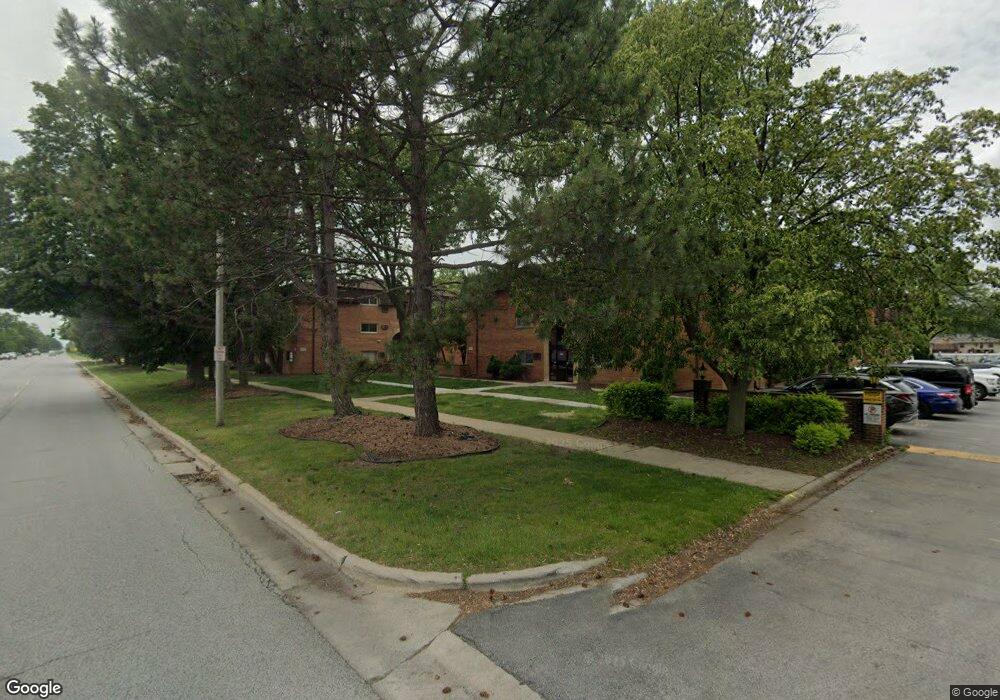
18555 Hickory Ct Unit 318 Lansing, IL 60438
Estimated Value: $74,616 - $90,000
3
Beds
2
Baths
1,000
Sq Ft
$82/Sq Ft
Est. Value
About This Home
This home is located at 18555 Hickory Ct Unit 318, Lansing, IL 60438 and is currently estimated at $82,154, approximately $82 per square foot. 18555 Hickory Ct Unit 318 is a home located in Cook County with nearby schools including Oak Glen Elementary School, Memorial Jr High School, and Thornton Fractnl So High School.
Ownership History
Date
Name
Owned For
Owner Type
Purchase Details
Closed on
Jan 6, 2017
Sold by
Harmon Kenyatta
Bought by
K & T Enterprises 1 Inc
Current Estimated Value
Purchase Details
Closed on
Dec 2, 2014
Sold by
Deutsche Bank National Trust Company
Bought by
Harmon Kenyatta
Purchase Details
Closed on
Apr 1, 2014
Sold by
Wilmington
Bought by
Deutsche Bank National Trust Company
Purchase Details
Closed on
Jul 11, 2006
Sold by
Zingo Mark B and Zingo Andrea A
Bought by
Wilmington Dwayna T
Home Financials for this Owner
Home Financials are based on the most recent Mortgage that was taken out on this home.
Original Mortgage
$54,300
Interest Rate
7.62%
Mortgage Type
Purchase Money Mortgage
Purchase Details
Closed on
Aug 26, 1995
Sold by
Columbia National Bank Of Chicago
Bought by
Zingo Mark B and Zingo Andrea A
Home Financials for this Owner
Home Financials are based on the most recent Mortgage that was taken out on this home.
Original Mortgage
$60,800
Interest Rate
7.78%
Mortgage Type
FHA
Create a Home Valuation Report for This Property
The Home Valuation Report is an in-depth analysis detailing your home's value as well as a comparison with similar homes in the area
Home Values in the Area
Average Home Value in this Area
Purchase History
| Date | Buyer | Sale Price | Title Company |
|---|---|---|---|
| K & T Enterprises 1 Inc | -- | None Available | |
| Harmon Kenyatta | $15,000 | None Available | |
| Deutsche Bank National Trust Company | -- | None Available | |
| Wilmington Dwayna T | $79,500 | Multiple | |
| Zingo Mark B | $62,500 | -- |
Source: Public Records
Mortgage History
| Date | Status | Borrower | Loan Amount |
|---|---|---|---|
| Previous Owner | Wilmington Dwayna T | $54,300 | |
| Previous Owner | Zingo Mark B | $60,800 |
Source: Public Records
Tax History Compared to Growth
Tax History
| Year | Tax Paid | Tax Assessment Tax Assessment Total Assessment is a certain percentage of the fair market value that is determined by local assessors to be the total taxable value of land and additions on the property. | Land | Improvement |
|---|---|---|---|---|
| 2024 | $1,318 | $6,040 | $932 | $5,108 |
| 2023 | $377 | $6,040 | $932 | $5,108 |
| 2022 | $377 | $4,002 | $847 | $3,155 |
| 2021 | $423 | $4,000 | $846 | $3,154 |
| 2020 | $527 | $4,000 | $846 | $3,154 |
| 2019 | $1,406 | $2,470 | $762 | $1,708 |
| 2018 | $1,380 | $2,470 | $762 | $1,708 |
| 2017 | $1,394 | $2,470 | $762 | $1,708 |
| 2016 | $653 | $3,692 | $677 | $3,015 |
| 2015 | $1,876 | $3,692 | $677 | $3,015 |
| 2014 | $563 | $3,692 | $677 | $3,015 |
| 2013 | $1,159 | $4,425 | $677 | $3,748 |
Source: Public Records
Map
Nearby Homes
- 2345 185th Ct Unit 25
- 18550 Torrence Ave Unit 19
- 18550 Torrence Ave Unit 15
- 18508 Torrence Ave
- 18518 Glen Oak Ave
- 2444 187th St
- 18503 Arcadia Ave
- 2444 187th Place
- 18429 Arcadia Ave
- 18340 Glen Oak Ave Unit 1D
- 18340 Glen Oak Ave Unit 3C
- 18307 Locust St
- 18309 Bock Rd
- 18559 Escanaba Ave Unit 305
- 18443 De Jong Ln
- 2290 182nd Place
- 18539 Country Ln
- 18235 Exchange Ave
- 2606 Ridge Rd
- 2616 Ridge Rd
- 18555 Hickory Ct Unit 3
- 18555 Hickory Ct Unit 14
- 18555 Hickory Ct Unit 320
- 18555 Hickory Ct Unit 35
- 18555 Hickory Ct Unit 323
- 18555 Hickory Ct Unit 316
- 18555 Hickory Ct Unit 326
- 18555 Hickory Ct Unit 38
- 18555 Hickory Ct Unit 32
- 18555 Hickory Ct Unit 311
- 18555 Hickory Ct Unit 310
- 18555 Hickory Ct Unit 322
- 18555 Hickory Ct Unit 321
- 18555 Hickory Ct Unit 315
- 18555 Hickory Ct Unit 327
- 18555 Hickory Ct Unit 31
- 18555 Hickory Ct Unit 312
- 18555 Hickory Ct Unit 317
- 18555 Hickory Ct Unit 34
- 18555 Hickory Ct Unit 325