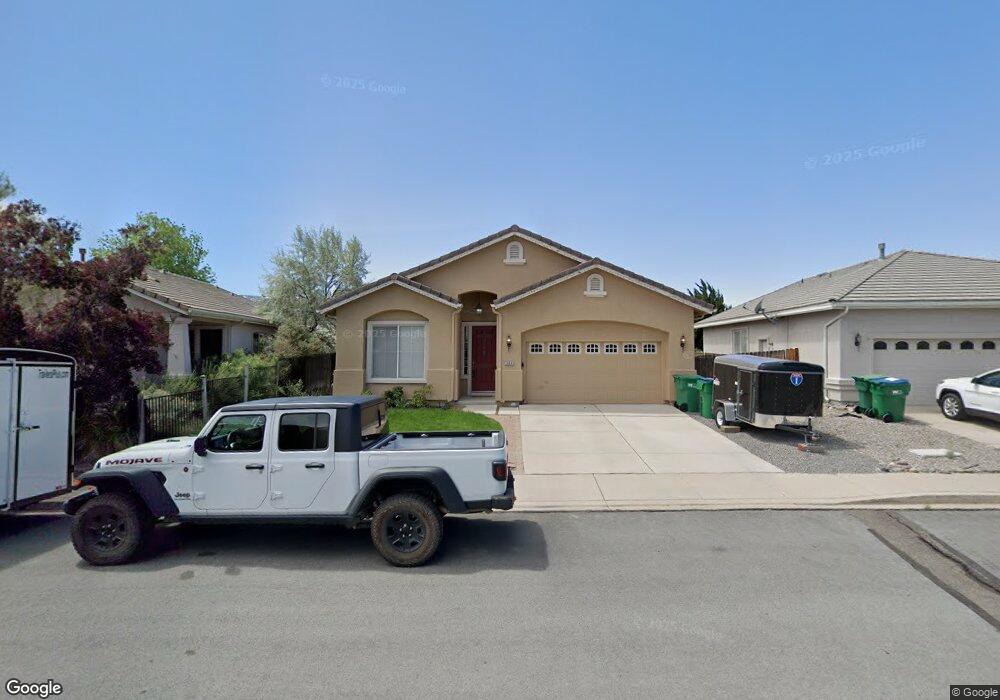
1856 Millpond Ct Reno, NV 89523
Northgate NeighborhoodEstimated Value: $502,156 - $561,000
3
Beds
2
Baths
1,410
Sq Ft
$384/Sq Ft
Est. Value
About This Home
This home is located at 1856 Millpond Ct, Reno, NV 89523 and is currently estimated at $541,289, approximately $383 per square foot. 1856 Millpond Ct is a home located in Washoe County with nearby schools including B D Billinghurst Middle School, Robert McQueen High School, and Riverview Christian Academy.
Ownership History
Date
Name
Owned For
Owner Type
Purchase Details
Closed on
Jun 23, 2021
Sold by
Thomas Lisa Marie and Black Lisa Marie
Bought by
Thomas Lisa Marie
Current Estimated Value
Home Financials for this Owner
Home Financials are based on the most recent Mortgage that was taken out on this home.
Original Mortgage
$320,000
Outstanding Balance
$289,720
Interest Rate
2.9%
Mortgage Type
New Conventional
Estimated Equity
$251,569
Purchase Details
Closed on
Nov 17, 2006
Sold by
Fricke Kathy J and Anderson Aurelia F
Bought by
Black Lisa Marie
Home Financials for this Owner
Home Financials are based on the most recent Mortgage that was taken out on this home.
Original Mortgage
$255,200
Interest Rate
6.28%
Mortgage Type
Unknown
Purchase Details
Closed on
Mar 23, 2001
Sold by
Bailey and Bailey Dutton
Bought by
Fricke Kathy J and Anderson Aurela F
Home Financials for this Owner
Home Financials are based on the most recent Mortgage that was taken out on this home.
Original Mortgage
$159,150
Interest Rate
6.97%
Create a Home Valuation Report for This Property
The Home Valuation Report is an in-depth analysis detailing your home's value as well as a comparison with similar homes in the area
Home Values in the Area
Average Home Value in this Area
Purchase History
| Date | Buyer | Sale Price | Title Company |
|---|---|---|---|
| Thomas Lisa Marie | -- | Solidifi Title Agency Ltd | |
| Black Lisa Marie | $319,000 | Stewart Title Of Northern Nv | |
| Fricke Kathy J | $168,000 | Stewart Title Northern Nevad |
Source: Public Records
Mortgage History
| Date | Status | Borrower | Loan Amount |
|---|---|---|---|
| Open | Thomas Lisa Marie | $320,000 | |
| Closed | Black Lisa Marie | $255,200 | |
| Previous Owner | Fricke Kathy J | $159,150 |
Source: Public Records
Tax History Compared to Growth
Tax History
| Year | Tax Paid | Tax Assessment Tax Assessment Total Assessment is a certain percentage of the fair market value that is determined by local assessors to be the total taxable value of land and additions on the property. | Land | Improvement |
|---|---|---|---|---|
| 2025 | $2,472 | $105,138 | $41,396 | $63,742 |
| 2024 | $2,472 | $98,167 | $33,948 | $64,219 |
| 2023 | $2,401 | $98,439 | $37,606 | $60,833 |
| 2022 | $2,332 | $82,591 | $31,887 | $50,705 |
| 2021 | $2,265 | $75,877 | $25,436 | $50,441 |
| 2020 | $2,197 | $76,023 | $25,470 | $50,553 |
| 2019 | $2,133 | $84,634 | $36,194 | $48,440 |
| 2018 | $2,071 | $66,184 | $18,786 | $47,398 |
| 2017 | $2,014 | $65,059 | $17,589 | $47,470 |
| 2016 | $1,964 | $64,771 | $16,725 | $48,046 |
| 2015 | $1,960 | $62,173 | $14,264 | $47,909 |
| 2014 | $1,901 | $58,564 | $12,303 | $46,261 |
| 2013 | -- | $50,239 | $9,210 | $41,029 |
Source: Public Records
Map
Nearby Homes
- 6811 Sonterra Ln
- 1836 Cambridge Hills Ct
- 1664 Shadow Wood Rd
- 6673 Enchanted Valley Dr
- 1055 Udowski Unit Homesite 53
- 1025 Udowski Unit Homesite 56
- 0 Unit 250003854
- 1651 Ashbury Ln
- 6460 Valley Wood Dr
- 6440 Enchanted Valley Dr
- 2014 Cradle Mountain Dr Unit 2
- 6368 Springwood Dr
- 1410 Crosswater Dr
- 7350 Austin Creek Ct
- 2163 3 Wood Ln
- 1585 Springfield Park Dr Unit 16G
- 6339 Park Place
- 2365 Red Maple Ct
- 6310 Park Place
- 1931 E Minaret Cir
- 1848 Millpond Ct
- 1864 Millpond Ct
- 1840 Millpond Ct
- 1872 Millpond Ct
- 1849 Millpond Ct
- 1841 Millpond Ct
- 1832 Millpond Ct
- 1880 Millpond Ct
- 1833 Millpond Ct
- 1824 Millpond Ct
- 6751 Sonterra Ln
- 1888 Millpond Ct
- 6761 Sonterra Ln
- 6705 Diamond Glen Dr
- 6741 Sonterra Ln
- 1641 Sonterra Ct
- 1816 Millpond Ct
- 6715 Diamond Glen Dr
- 6715 Diamond Glen Dr
- 6781 Sonterra Ln