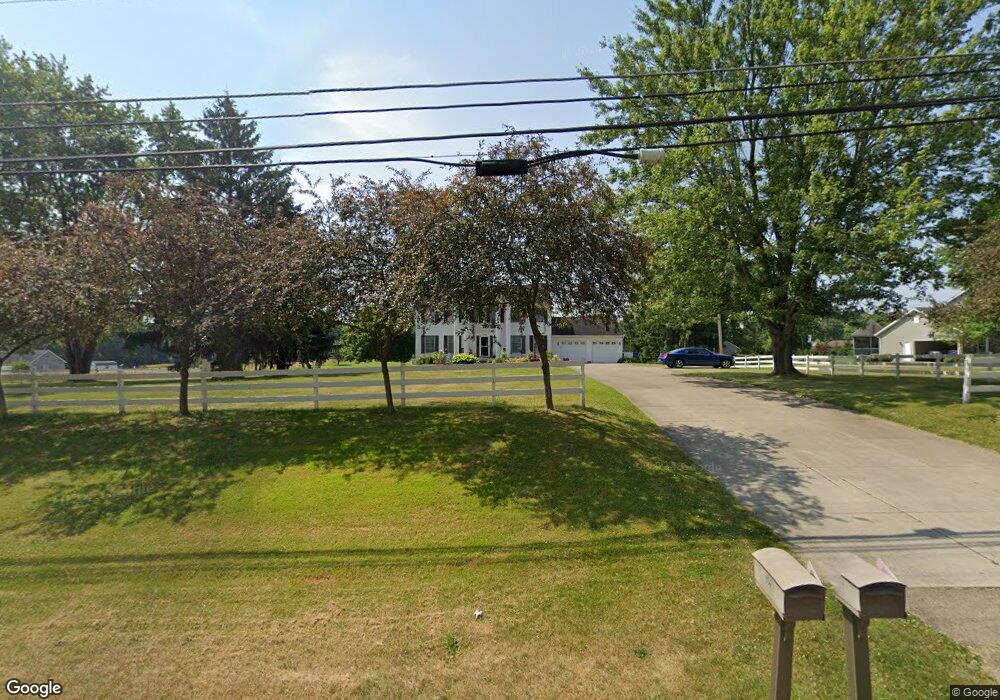
1856 W Nimisila Rd New Franklin, OH 44216
Estimated Value: $349,897 - $396,000
4
Beds
3
Baths
2,052
Sq Ft
$184/Sq Ft
Est. Value
About This Home
This home is located at 1856 W Nimisila Rd, New Franklin, OH 44216 and is currently estimated at $376,974, approximately $183 per square foot. 1856 W Nimisila Rd is a home located in Summit County with nearby schools including Northwest Primary School, W.S. Stinson Elementary School, and Northwest Middle School.
Ownership History
Date
Name
Owned For
Owner Type
Purchase Details
Closed on
Dec 30, 1997
Sold by
Parsons Joseph D
Bought by
Justice Brian L and Justice Carol A
Current Estimated Value
Home Financials for this Owner
Home Financials are based on the most recent Mortgage that was taken out on this home.
Original Mortgage
$160,300
Outstanding Balance
$24,511
Interest Rate
6.5%
Mortgage Type
New Conventional
Estimated Equity
$352,463
Purchase Details
Closed on
Jul 30, 1996
Sold by
Graves Bette R
Bought by
Parsons Joseph D and Parsons Lena A
Home Financials for this Owner
Home Financials are based on the most recent Mortgage that was taken out on this home.
Original Mortgage
$89,182
Interest Rate
8.43%
Mortgage Type
New Conventional
Create a Home Valuation Report for This Property
The Home Valuation Report is an in-depth analysis detailing your home's value as well as a comparison with similar homes in the area
Home Values in the Area
Average Home Value in this Area
Purchase History
| Date | Buyer | Sale Price | Title Company |
|---|---|---|---|
| Justice Brian L | $195,000 | -- | |
| Parsons Joseph D | $112,512 | -- |
Source: Public Records
Mortgage History
| Date | Status | Borrower | Loan Amount |
|---|---|---|---|
| Open | Justice Brian L | $160,300 | |
| Previous Owner | Parsons Joseph D | $89,182 |
Source: Public Records
Tax History Compared to Growth
Tax History
| Year | Tax Paid | Tax Assessment Tax Assessment Total Assessment is a certain percentage of the fair market value that is determined by local assessors to be the total taxable value of land and additions on the property. | Land | Improvement |
|---|---|---|---|---|
| 2025 | $4,273 | $96,681 | $21,287 | $75,394 |
| 2024 | $4,273 | $96,681 | $21,287 | $75,394 |
| 2023 | $4,273 | $96,681 | $21,287 | $75,394 |
| 2022 | $3,514 | $72,188 | $15,768 | $56,420 |
| 2021 | $3,523 | $72,188 | $15,768 | $56,420 |
| 2020 | $3,533 | $72,190 | $15,770 | $56,420 |
| 2019 | $3,613 | $71,320 | $15,770 | $55,550 |
| 2018 | $3,611 | $71,320 | $15,770 | $55,550 |
| 2017 | $3,330 | $71,320 | $15,770 | $55,550 |
| 2016 | $3,277 | $60,970 | $15,770 | $45,200 |
| 2015 | $3,330 | $60,970 | $15,770 | $45,200 |
| 2014 | $3,476 | $60,970 | $15,770 | $45,200 |
| 2013 | $3,815 | $66,980 | $15,770 | $51,210 |
Source: Public Records
Map
Nearby Homes
- 2200 W Comet Rd
- 6387 Hampsher Rd
- 8177 S Cleveland Massillon Rd Unit 16
- 8177 S Cleveland Massillon Rd Unit 42
- 1062 Stump Rd
- 8941 Shoemaker Ave NW
- 899 Loway Dr
- 6090 Manchester Rd Unit 6096
- 7452 S Cleveland Massillon Rd
- 8714 Greenmeadow Ave NW
- 5776 Harter Home Dr
- 8113 Erie Ave NW
- 8089 Erie Ave NW
- 341 Alexis Ln
- 8055 Erie Ave NW
- 781 Leeman Dr
- 7985 Leaver Ave NW
- 765 Longview Ave
- 7060 Manchester Rd
- 6407 Southview Dr
- 1876 W Nimisila Rd
- 1896 W Nimisila Rd
- 1901 W Nimisila Rd
- 1816 W Nimisila Rd
- 1919 W Nimisila Rd
- 1920 W Nimisila Rd
- 6961 Kepler Rd
- 1927 W Nimisila Rd
- 1946 W Nimisila Rd
- 6911 Kepler Rd
- 6885 Kepler Rd
- 6981 Kepler Rd
- 6871 Kepler Rd
- 6853 Kepler Rd
- 1984 W Nimisila Rd
- 7007 Kepler Rd
- 6837 Kepler Rd
- 6900 Kepler Rd
- 6823 Kepler Rd
- 6890 Kepler Rd