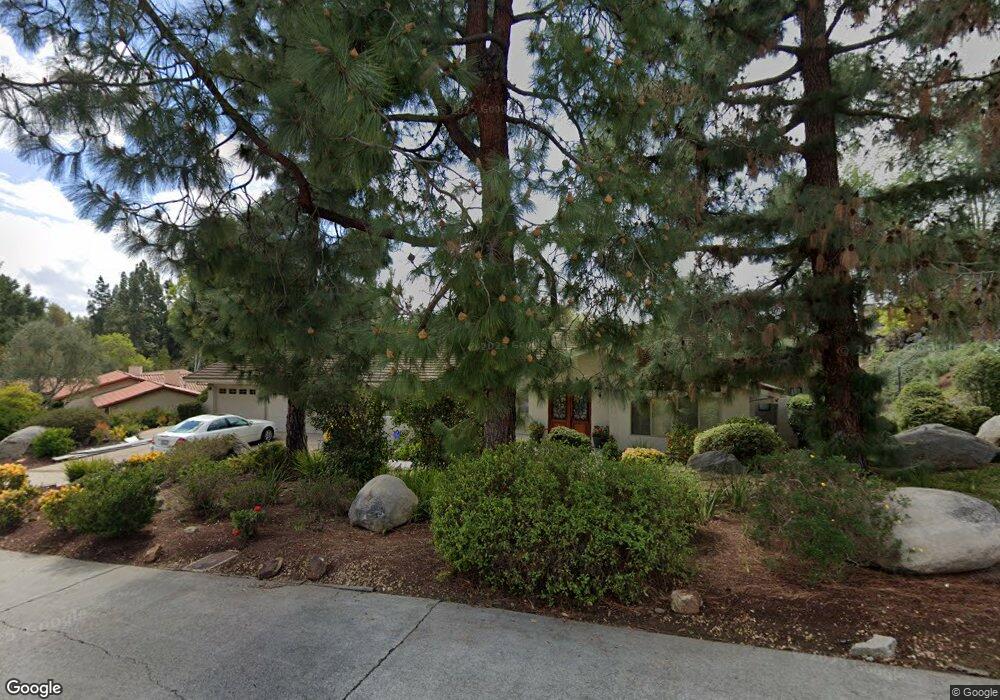
18560 Polvera Dr San Diego, CA 92128
Rancho Bernardo NeighborhoodEstimated Value: $2,020,835 - $2,367,000
4
Beds
3
Baths
3,310
Sq Ft
$672/Sq Ft
Est. Value
About This Home
This home is located at 18560 Polvera Dr, San Diego, CA 92128 and is currently estimated at $2,222,959, approximately $671 per square foot. 18560 Polvera Dr is a home located in San Diego County with nearby schools including Chaparral Elementary, Bernardo Heights Middle, and Rancho Bernardo High.
Ownership History
Date
Name
Owned For
Owner Type
Purchase Details
Closed on
Jan 29, 2018
Sold by
Weir Mark A and Loiewski Diana R
Bought by
Weir Mark A and Loiewski Diana R
Current Estimated Value
Purchase Details
Closed on
Jul 31, 2000
Sold by
Nsns
Bought by
Weir Mark A and Loiewski Diana R
Home Financials for this Owner
Home Financials are based on the most recent Mortgage that was taken out on this home.
Original Mortgage
$320,000
Outstanding Balance
$115,783
Interest Rate
8.19%
Estimated Equity
$2,107,176
Purchase Details
Closed on
May 13, 2000
Sold by
Cowen David L
Bought by
Cowen David Lindsay
Purchase Details
Closed on
Apr 13, 1996
Sold by
Cowen D Eugene
Bought by
Cowen Hulda H
Purchase Details
Closed on
Jul 13, 1994
Sold by
Paroly Warren S and Paroly Janet M
Bought by
Cowen D Eugene and Cowen Hulda H
Create a Home Valuation Report for This Property
The Home Valuation Report is an in-depth analysis detailing your home's value as well as a comparison with similar homes in the area
Home Values in the Area
Average Home Value in this Area
Purchase History
| Date | Buyer | Sale Price | Title Company |
|---|---|---|---|
| Weir Mark A | -- | None Available | |
| Weir Mark A | $739,000 | Stewart Title | |
| Cowen David Lindsay | -- | -- | |
| Cowen Hulda H | -- | -- | |
| Cowen D Eugene | $490,000 | Old Republic Title Company |
Source: Public Records
Mortgage History
| Date | Status | Borrower | Loan Amount |
|---|---|---|---|
| Open | Weir Mark A | $320,000 |
Source: Public Records
Tax History Compared to Growth
Tax History
| Year | Tax Paid | Tax Assessment Tax Assessment Total Assessment is a certain percentage of the fair market value that is determined by local assessors to be the total taxable value of land and additions on the property. | Land | Improvement |
|---|---|---|---|---|
| 2025 | $12,272 | $1,113,544 | $527,386 | $586,158 |
| 2024 | $12,272 | $1,091,711 | $517,046 | $574,665 |
| 2023 | $12,011 | $1,070,306 | $506,908 | $563,398 |
| 2022 | $11,810 | $1,049,320 | $496,969 | $552,351 |
| 2021 | $11,654 | $1,028,746 | $487,225 | $541,521 |
| 2020 | $11,496 | $1,018,199 | $482,230 | $535,969 |
| 2019 | $11,196 | $998,235 | $472,775 | $525,460 |
| 2018 | $10,880 | $978,662 | $463,505 | $515,157 |
| 2017 | $10,588 | $959,473 | $454,417 | $505,056 |
| 2016 | $10,371 | $940,660 | $445,507 | $495,153 |
| 2015 | $10,216 | $926,532 | $438,816 | $487,716 |
| 2014 | $9,973 | $908,384 | $430,221 | $478,163 |
Source: Public Records
Map
Nearby Homes
- 17842 Avenida Cordillera Unit 30
- 12732 Camino de la Breccia Unit 9
- 12982 Polvera Ct
- 12977 Camino Emparrado
- 12564 Chetenham Ln
- 18304 Vezelay Ln
- 12916 Polvera Ave
- 12870 Camino de la Breccia
- 18035 Avenida Alozdra Unit 298
- 12725 Via Nasca
- 18358 Locksley St
- 12865 Camino de la Breccia Unit 109
- 17762 Plaza Acosta
- 17738 Plaza Acosta
- 12516 Camino Vuelo
- 17676 Corte Sobrado
- 12512 Cloudesly Dr
- 12880 Circulo Dardo
- 18787 Aceituno St
- 18818 Bernardo Trails Dr Unit 6
- 18540 Polvera Dr
- 18580 Polvera Dr
- 18545 Polvera Dr
- 18585 Polvera Dr
- 18520 Polvera Dr
- 18580 Bernardo Trails Dr
- 18025 Polvera Way
- 18555 Polvera Dr
- 18565 Polvera Dr
- 18035 Polvera Way
- 18030 Polvera Way
- 18610 Bernardo Trails Dr
- 18630 Polvera Dr Unit 2
- 18495 Bernardo Trails Ct
- 18520 Bernardo Trails Dr
- 18535 Bernardo Trails Dr
- 18595 Bernardo Trails Dr
- 18490 Bernardo Trails Ct
- 12945 Robleda Cove
- 18630 Bernardo Trails Dr Unit 3