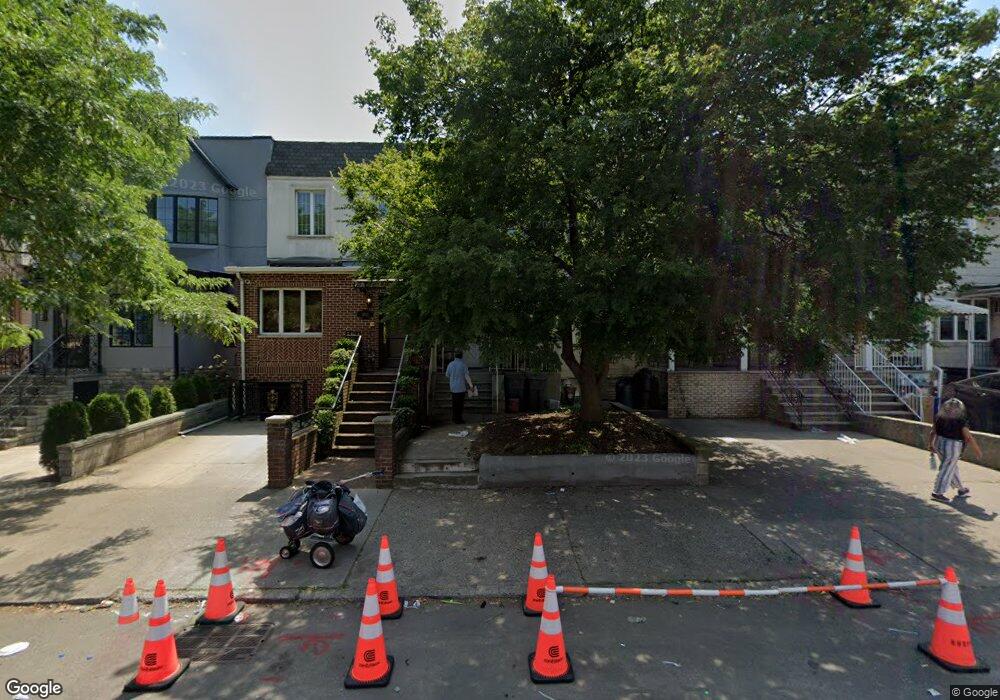
1858 60th St Brooklyn, NY 11204
Mapleton NeighborhoodEstimated Value: $1,479,000 - $1,554,195
Studio
--
Bath
1,472
Sq Ft
$1,024/Sq Ft
Est. Value
About This Home
This home is located at 1858 60th St, Brooklyn, NY 11204 and is currently estimated at $1,507,549, approximately $1,024 per square foot. 1858 60th St is a home located in Kings County with nearby schools including P.S. 048 Mapleton, Junior High School 227 Edward B Shallow, and Franklin Delano Roosevelt High School.
Ownership History
Date
Name
Owned For
Owner Type
Purchase Details
Closed on
Jul 23, 2013
Sold by
Gordon Ira and Gordon Sarah
Bought by
Wolf Tzvi
Current Estimated Value
Home Financials for this Owner
Home Financials are based on the most recent Mortgage that was taken out on this home.
Original Mortgage
$417,000
Outstanding Balance
$307,200
Interest Rate
4.31%
Mortgage Type
New Conventional
Estimated Equity
$1,200,349
Purchase Details
Closed on
Apr 20, 2004
Sold by
Gordon Sarah
Bought by
Gordon Ira and Gordon Sarah
Purchase Details
Closed on
Nov 24, 1998
Sold by
Giannone Michael
Bought by
Gordon Sarah
Home Financials for this Owner
Home Financials are based on the most recent Mortgage that was taken out on this home.
Original Mortgage
$137,750
Interest Rate
6.78%
Create a Home Valuation Report for This Property
The Home Valuation Report is an in-depth analysis detailing your home's value as well as a comparison with similar homes in the area
Home Values in the Area
Average Home Value in this Area
Purchase History
| Date | Buyer | Sale Price | Title Company |
|---|---|---|---|
| Wolf Tzvi | $670,000 | -- | |
| Wolf Tzvi | $670,000 | -- | |
| Gordon Ira | -- | -- | |
| Gordon Ira | -- | -- | |
| Gordon Sarah | $145,000 | Commonwealth Land Title Ins | |
| Gordon Sarah | $145,000 | Commonwealth Land Title Ins |
Source: Public Records
Mortgage History
| Date | Status | Borrower | Loan Amount |
|---|---|---|---|
| Open | Wolf Tzvi | $417,000 | |
| Closed | Wolf Tzvi | $417,000 | |
| Previous Owner | Gordon Sarah | $137,750 | |
| Closed | Gordon Ira | $0 |
Source: Public Records
Tax History
| Year | Tax Paid | Tax Assessment Tax Assessment Total Assessment is a certain percentage of the fair market value that is determined by local assessors to be the total taxable value of land and additions on the property. | Land | Improvement |
|---|---|---|---|---|
| 2025 | $8,607 | $82,140 | $17,280 | $64,860 |
| 2024 | $8,607 | $73,620 | $17,280 | $56,340 |
| 2023 | $8,510 | $65,520 | $17,280 | $48,240 |
| 2022 | $8,365 | $53,640 | $17,280 | $36,360 |
| 2021 | $8,444 | $49,140 | $17,280 | $31,860 |
| 2020 | $3,960 | $51,720 | $17,280 | $34,440 |
| 2019 | $7,471 | $51,720 | $17,280 | $34,440 |
| 2018 | $7,118 | $34,920 | $9,278 | $25,642 |
| 2017 | $7,118 | $34,920 | $10,631 | $24,289 |
| 2016 | $6,684 | $33,437 | $12,687 | $20,750 |
| 2015 | $3,860 | $31,545 | $16,965 | $14,580 |
| 2014 | $3,860 | $29,760 | $19,200 | $10,560 |
Source: Public Records
Map
Nearby Homes
- 6109 19th Ave
- 1831 62nd St
- 6119 20th Ave
- 1956 64th St
- 1966 64th St
- 1972 64th St
- 1953 65th St Unit 1D
- 1961 65th St Unit 3B
- 1807 66th St Unit 4E
- 1807 66th St Unit 7a
- 1807 66th St Unit 7B
- 1807 66th St Unit 5B
- 1807 66th St Unit 3D
- 1772 55th St
- 1768 55th St
- 2050 58th St
- 1822 66th St
- 6604 18th Ave
- 1732 65th St
- 2084 61st St
Your Personal Tour Guide
Ask me questions while you tour the home.