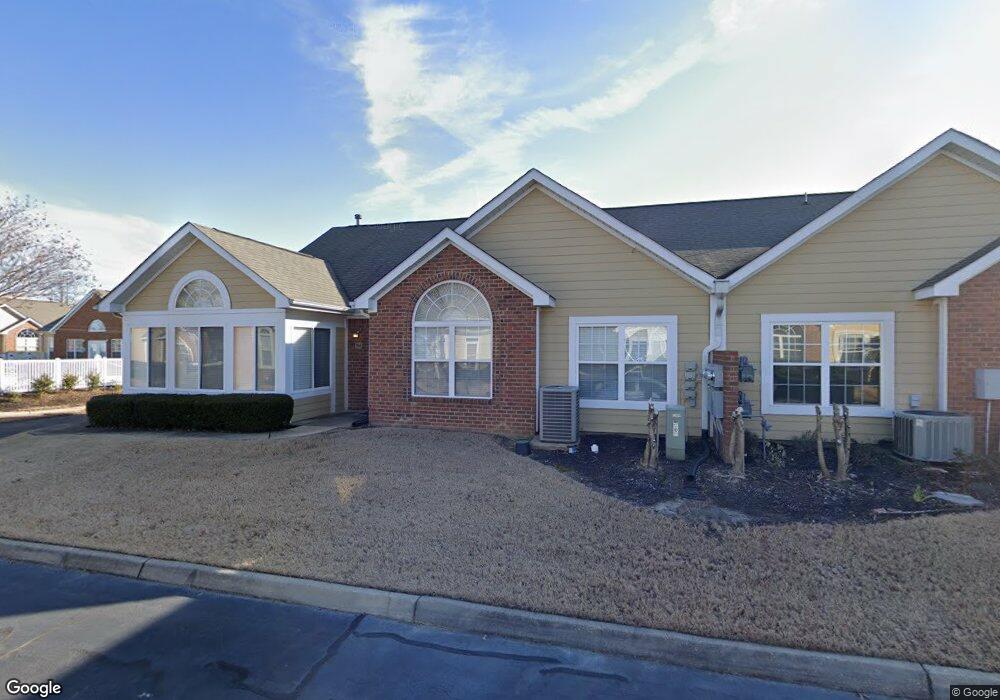
1858 Appling Oaks Cir Unit 39 Cordova, TN 38016
Cordova NeighborhoodEstimated Value: $239,970 - $257,000
3
Beds
2
Baths
1,670
Sq Ft
$147/Sq Ft
Est. Value
About This Home
This home is located at 1858 Appling Oaks Cir Unit 39, Cordova, TN 38016 and is currently estimated at $246,243, approximately $147 per square foot. 1858 Appling Oaks Cir Unit 39 is a home located in Shelby County with nearby schools including Dexter Elementary School, Dexter Middle School, and Cordova High School.
Ownership History
Date
Name
Owned For
Owner Type
Purchase Details
Closed on
Oct 29, 2018
Sold by
Cagle Patricia
Bought by
Manuel Willie
Current Estimated Value
Home Financials for this Owner
Home Financials are based on the most recent Mortgage that was taken out on this home.
Original Mortgage
$144,530
Outstanding Balance
$126,563
Interest Rate
4.6%
Mortgage Type
New Conventional
Estimated Equity
$119,680
Purchase Details
Closed on
Apr 16, 2018
Sold by
Gott Nancy K and Gott Edgar L
Bought by
Cagle Patricia
Purchase Details
Closed on
Nov 30, 2011
Sold by
Gott Edgar L and Gott Nancy K
Bought by
Gott Nancy K
Purchase Details
Closed on
Jul 20, 2004
Sold by
Kemmons Wilson Inc
Bought by
Gott Edgar L and Gott Nancy K
Home Financials for this Owner
Home Financials are based on the most recent Mortgage that was taken out on this home.
Original Mortgage
$189,000
Interest Rate
6.39%
Mortgage Type
Credit Line Revolving
Create a Home Valuation Report for This Property
The Home Valuation Report is an in-depth analysis detailing your home's value as well as a comparison with similar homes in the area
Home Values in the Area
Average Home Value in this Area
Purchase History
| Date | Buyer | Sale Price | Title Company |
|---|---|---|---|
| Manuel Willie | $149,000 | Edco Title & Closing Svcs In | |
| Cagle Patricia | $142,000 | Edco Title & Closing Svcs In | |
| Gott Nancy K | -- | Multiple | |
| Gott Edgar L | $189,000 | None Available |
Source: Public Records
Mortgage History
| Date | Status | Borrower | Loan Amount |
|---|---|---|---|
| Open | Manuel Willie | $144,530 | |
| Previous Owner | Gott Edgar L | $189,000 |
Source: Public Records
Tax History Compared to Growth
Tax History
| Year | Tax Paid | Tax Assessment Tax Assessment Total Assessment is a certain percentage of the fair market value that is determined by local assessors to be the total taxable value of land and additions on the property. | Land | Improvement |
|---|---|---|---|---|
| 2025 | $1,529 | $66,400 | $5,800 | $60,600 |
| 2024 | $1,529 | $45,100 | $5,800 | $39,300 |
| 2023 | $1,529 | $45,100 | $5,800 | $39,300 |
| 2022 | $1,529 | $45,100 | $5,800 | $39,300 |
| 2021 | $1,556 | $45,100 | $5,800 | $39,300 |
| 2020 | $1,405 | $34,700 | $5,800 | $28,900 |
| 2019 | $1,405 | $34,700 | $5,800 | $28,900 |
| 2018 | $1,405 | $34,700 | $5,800 | $28,900 |
| 2017 | $1,426 | $34,700 | $5,800 | $28,900 |
| 2016 | $1,486 | $34,000 | $0 | $0 |
| 2014 | $1,486 | $34,000 | $0 | $0 |
Source: Public Records
Map
Nearby Homes
- 1862 Appling Oaks Cir Unit 37
- 1801 Appling Oaks Cir Unit 83
- 1753 Appling Oaks Cir Unit 49
- 1655 S Ryamar Cove
- 1595 Dexter Grove Ct Unit E105
- 1595 Dexter Grove Ct Unit D101
- 7407 Lost Grove Ln
- 1520 Cider House Ln
- 7410 Appling Rain Dr
- 7412 Lost Trail Dr
- 7426 Lost Trail Dr
- 7153 Tulip Trail Dr
- 1895 Wood Oak Dr
- 7646 Dexter Run Cir
- 7693 Killdeer Ln
- 7211 Butterfly Dr
- 7246 Butterfly Dr
- 1592 W Southfield Cir Unit 52
- 2065 Steeplebrook Dr
- 7520 Crystal Lake Dr
- 1854 Appling Oaks Cir Unit 40
- 1850 Appling Oaks Cir Unit 38
- 1873 Appling Oaks Cir Unit 5
- 1885 Appling Oaks Cir Unit 10
- 1818 Appling Oaks Cir Unit 86
- 1889 Appling Oaks Cir Unit 9
- 1824 Appling Oaks Cir Unit 88
- 1886 Appling Oaks Cir Unit 35
- 1842 Appling Oaks Cir Unit 87
- 1901 Appling Oaks Cir Unit 14
- 1881 Appling Oaks Cir Unit 12
- 7413 Appling Oaks Dr Unit 44
- 1869 Appling Oaks Cir Unit 6 Bldg 2
- 1973 Appling Oaks Cir Unit 41
- 1962 Appling Oaks Cir Unit 36
- 1893 Appling Oaks Cir Unit 11
- 1894 Appling Oaks Cir Unit 33
- 1877 Appling Oaks Cir Unit 7
- 1905 Appling Oaks Cir Unit 4
- 1905 Appling Oaks Cir Unit 13