Estimated Value: $211,000 - $257,000
4
Beds
2
Baths
2,048
Sq Ft
$112/Sq Ft
Est. Value
About This Home
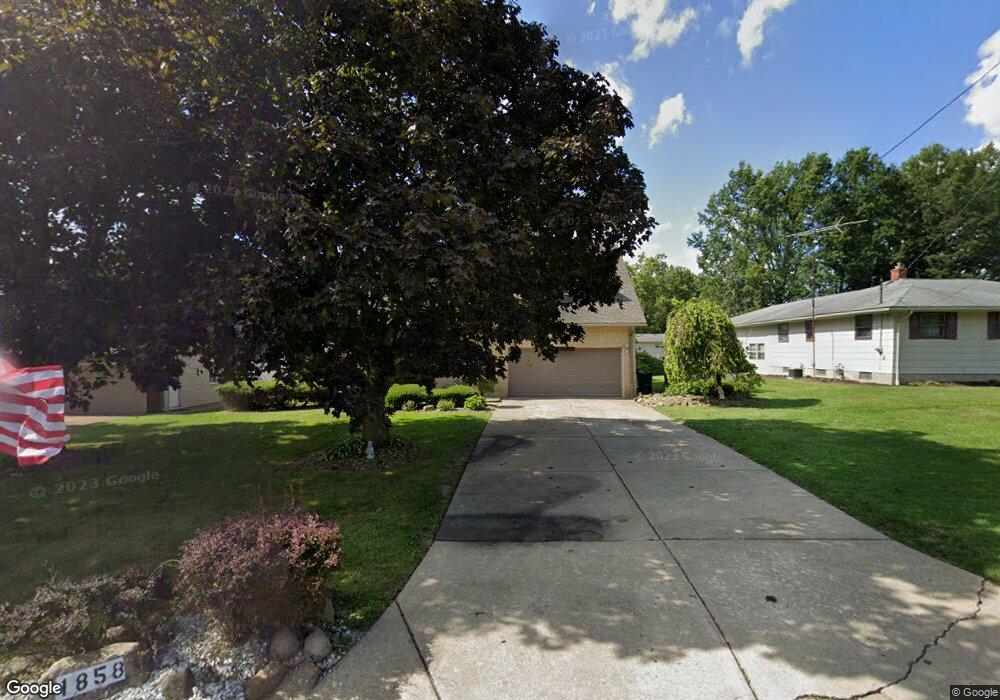
This home is located at 1858 Belle Terre Ave, Niles, OH 44446 and is currently estimated at $230,367, approximately $112 per square foot. 1858 Belle Terre Ave is a home located in Trumbull County with nearby schools including Niles Primary School, Niles Intermediate School, and Niles Middle School.
Ownership History
Date
Name
Owned For
Owner Type
Purchase Details
Closed on
Dec 27, 2019
Sold by
Biamonte Gail A
Bought by
Biamonte Vincent T
Current Estimated Value
Purchase Details
Closed on
Sep 5, 2017
Sold by
Dicintio Stella J
Bought by
Biamonte Gail A
Home Financials for this Owner
Home Financials are based on the most recent Mortgage that was taken out on this home.
Original Mortgage
$48,000
Outstanding Balance
$40,105
Interest Rate
3.92%
Mortgage Type
Future Advance Clause Open End Mortgage
Estimated Equity
$190,262
Purchase Details
Closed on
Oct 1, 2014
Sold by
Dicintio Stella J
Bought by
Biamonte Vincent T and Biamonte Laura D
Home Financials for this Owner
Home Financials are based on the most recent Mortgage that was taken out on this home.
Original Mortgage
$115,000
Interest Rate
4.07%
Mortgage Type
Seller Take Back
Purchase Details
Closed on
Jan 1, 1990
Bought by
Thomas Thomas N and Thomas E
Create a Home Valuation Report for This Property
The Home Valuation Report is an in-depth analysis detailing your home's value as well as a comparison with similar homes in the area
Home Values in the Area
Average Home Value in this Area
Purchase History
| Date | Buyer | Sale Price | Title Company |
|---|---|---|---|
| Biamonte Vincent T | -- | None Available | |
| Biamonte Gail A | $45,000 | None Available | |
| Dicintio Stella J | -- | None Available | |
| Biamonte Vincent T | $115,000 | None Available | |
| Thomas Thomas N | -- | -- |
Source: Public Records
Mortgage History
| Date | Status | Borrower | Loan Amount |
|---|---|---|---|
| Open | Biamonte Gail A | $48,000 | |
| Previous Owner | Biamonte Vincent T | $115,000 |
Source: Public Records
Tax History Compared to Growth
Tax History
| Year | Tax Paid | Tax Assessment Tax Assessment Total Assessment is a certain percentage of the fair market value that is determined by local assessors to be the total taxable value of land and additions on the property. | Land | Improvement |
|---|---|---|---|---|
| 2024 | $2,290 | $53,410 | $6,020 | $47,390 |
| 2023 | $2,290 | $53,410 | $6,020 | $47,390 |
| 2022 | $2,061 | $41,060 | $6,020 | $35,040 |
| 2021 | $2,165 | $41,060 | $6,020 | $35,040 |
| 2020 | $2,184 | $41,060 | $6,020 | $35,040 |
| 2019 | $2,183 | $39,060 | $6,020 | $33,040 |
| 2018 | $2,177 | $39,060 | $6,020 | $33,040 |
| 2017 | $1,635 | $39,060 | $6,020 | $33,040 |
| 2016 | $1,577 | $37,700 | $5,990 | $31,710 |
| 2015 | $1,559 | $37,700 | $5,990 | $31,710 |
| 2014 | $1,564 | $37,700 | $5,990 | $31,710 |
| 2013 | $1,586 | $39,730 | $5,990 | $33,740 |
Source: Public Records
Map
Nearby Homes
- 1919 Carnegie Heights Dr
- 352 N Rhodes Ave
- 2213 N Glenwood Ave
- 340 Mcevoy Ct
- 1804 Stepney St
- 364 Hogarth Ave
- 126 S Rhodes Ave
- 2153 Coates Dr
- 21 Summit Ave
- 2139 Coates Dr
- 924 Nob Hill Dr Unit 3
- 812 Hartzell Ave
- 820 Hartzell Ave
- 1317 Hartzell Ave
- 733 N Bentley Ave
- 737 N Bentley Ave
- 404 N Bentley Ave
- 1004 N Bentley Ave
- 0 Hughes St SE
- 311 High Ave
- 1850 Belle Terre Ave
- 1866 Belle Terre Ave
- 1855 Taft Ave
- 1876 Belle Terre Ave
- 1865 Taft Ave
- 1845 Taft Ave
- 1855 Belle Terre Ave
- 1865 Belle Terre Ave
- 1845 Belle Terre Ave
- 1869 Taft Ave
- 1835 Taft Ave
- 1826 Belle Terre Ave
- 1835 Belle Terre Ave
- 1890 Belle Terre Ave
- 1875 Taft Ave
- 1825 Taft Ave
- 1881 Belle Terre Ave
- 1881 Taft Ave
- 1825 Belle Terre Ave
- 1816 Belle Terre Ave