Estimated Value: $198,000 - $213,000
4
Beds
1
Bath
1,524
Sq Ft
$134/Sq Ft
Est. Value
About This Home
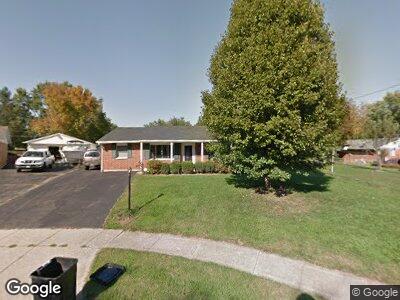
This home is located at 1858 Chippewa Ct, Xenia, OH 45385 and is currently estimated at $204,854, approximately $134 per square foot. 1858 Chippewa Ct is a home located in Greene County with nearby schools including Xenia High School, Summit Academy Community School for Alternative Learners - Xenia, and Legacy Christian Academy.
Ownership History
Date
Name
Owned For
Owner Type
Purchase Details
Closed on
Jun 29, 2005
Sold by
Loxley Daniel L and Loxley Sherry L
Bought by
Wylie Marcia A
Current Estimated Value
Home Financials for this Owner
Home Financials are based on the most recent Mortgage that was taken out on this home.
Original Mortgage
$103,530
Outstanding Balance
$56,386
Interest Rate
5.75%
Mortgage Type
FHA
Estimated Equity
$147,319
Purchase Details
Closed on
Oct 13, 1998
Sold by
Loxley Daniel L and Evans Sherry L
Bought by
Loxley Daniel L and Loxley Sherry L
Purchase Details
Closed on
Oct 8, 1997
Sold by
Barnett David
Bought by
Loxley Daniel L and Loxley L
Home Financials for this Owner
Home Financials are based on the most recent Mortgage that was taken out on this home.
Original Mortgage
$66,000
Interest Rate
7.7%
Mortgage Type
New Conventional
Create a Home Valuation Report for This Property
The Home Valuation Report is an in-depth analysis detailing your home's value as well as a comparison with similar homes in the area
Home Values in the Area
Average Home Value in this Area
Purchase History
| Date | Buyer | Sale Price | Title Company |
|---|---|---|---|
| Wylie Marcia A | $106,400 | -- | |
| Loxley Daniel L | -- | -- | |
| Loxley Daniel L | $85,200 | -- |
Source: Public Records
Mortgage History
| Date | Status | Borrower | Loan Amount |
|---|---|---|---|
| Open | Wylie Marcia A | $103,530 | |
| Closed | Wylie Marcia A | $4,256 | |
| Previous Owner | Loxley Daniel L | $20,000 | |
| Previous Owner | Loxley Daniel L | $7,000 | |
| Previous Owner | Loxley Daniel L | $76,000 | |
| Previous Owner | Loxley Daniel L | $66,000 |
Source: Public Records
Tax History Compared to Growth
Tax History
| Year | Tax Paid | Tax Assessment Tax Assessment Total Assessment is a certain percentage of the fair market value that is determined by local assessors to be the total taxable value of land and additions on the property. | Land | Improvement |
|---|---|---|---|---|
| 2024 | $2,331 | $55,900 | $12,920 | $42,980 |
| 2023 | $2,331 | $55,900 | $12,920 | $42,980 |
| 2022 | $1,957 | $40,020 | $7,600 | $32,420 |
| 2021 | $1,984 | $40,020 | $7,600 | $32,420 |
| 2020 | $1,898 | $40,020 | $7,600 | $32,420 |
| 2019 | $1,500 | $29,770 | $7,370 | $22,400 |
| 2018 | $1,506 | $29,770 | $7,370 | $22,400 |
| 2017 | $1,365 | $29,770 | $7,370 | $22,400 |
| 2016 | $1,366 | $26,500 | $7,370 | $19,130 |
| 2015 | $1,369 | $26,500 | $7,370 | $19,130 |
| 2014 | $1,310 | $26,500 | $7,370 | $19,130 |
Source: Public Records
Map
Nearby Homes
- 1853 Pueblo Dr
- 1669 Wigwam Trail
- 2975 Wyoming Dr
- 1579 Commonwealth Dr
- 1513 Maumee Dr
- 1583 Roxbury Dr
- 1371 Arrowhead Trail
- 1974 Connecticut Dr
- 1967 Drake Dr
- 2014 Vermont Dr
- 1361 Kylemore Dr
- 356 Kansas Dr
- 1015 Colorado Dr
- 1543 Rockwell Dr
- 121 S Progress Dr
- 2106 Tennessee Dr
- 2201 Nebraska Dr
- 2222 Carolina Dr
- 615 Concord Way
- 399 Concord Way