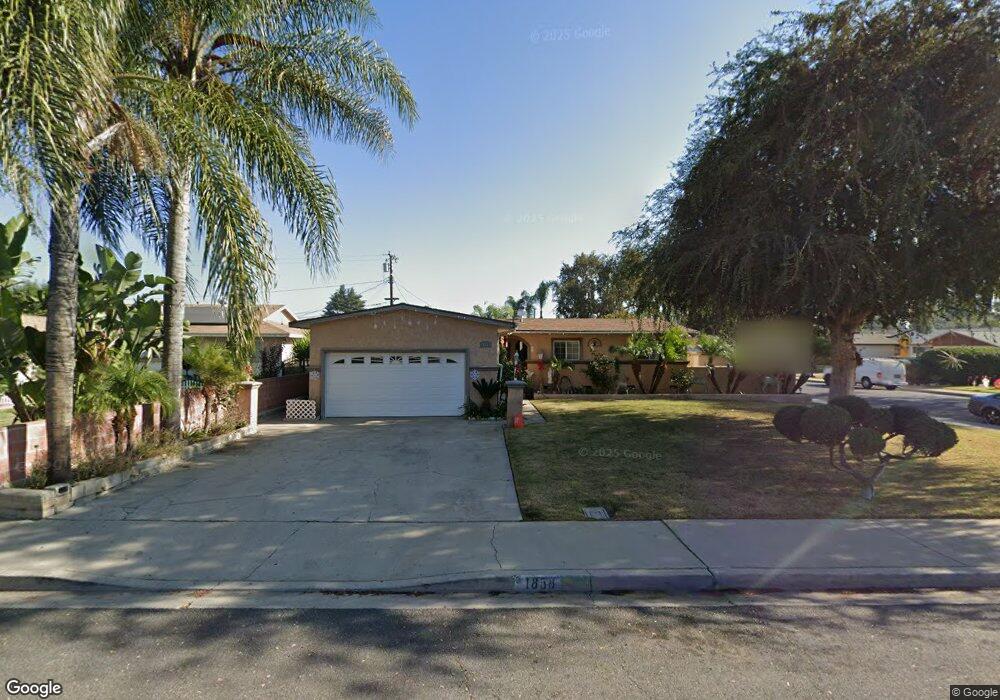
1858 Garland St Pomona, CA 91766
Rio Rancho NeighborhoodEstimated Value: $682,000 - $720,000
4
Beds
2
Baths
1,452
Sq Ft
$481/Sq Ft
Est. Value
About This Home
This home is located at 1858 Garland St, Pomona, CA 91766 and is currently estimated at $698,820, approximately $481 per square foot. 1858 Garland St is a home located in Los Angeles County with nearby schools including Lexington Elementary School, Fremont Academy of Engineering and Design, and Garey High School.
Ownership History
Date
Name
Owned For
Owner Type
Purchase Details
Closed on
Jan 8, 2019
Sold by
Rivera Gabriel Soto and Soto Gabriel
Bought by
Ramos Rivera Gabriel Soto and Ramos Mancilla Marieela
Current Estimated Value
Home Financials for this Owner
Home Financials are based on the most recent Mortgage that was taken out on this home.
Original Mortgage
$160,000
Outstanding Balance
$141,238
Interest Rate
4.8%
Mortgage Type
New Conventional
Estimated Equity
$557,582
Purchase Details
Closed on
Jul 8, 2003
Sold by
Soto Maribel
Bought by
Soto Gabriel
Home Financials for this Owner
Home Financials are based on the most recent Mortgage that was taken out on this home.
Original Mortgage
$157,000
Interest Rate
5.15%
Mortgage Type
Purchase Money Mortgage
Purchase Details
Closed on
May 1, 2001
Sold by
Easley Theresa M
Bought by
Soto Gabriel
Home Financials for this Owner
Home Financials are based on the most recent Mortgage that was taken out on this home.
Original Mortgage
$145,500
Interest Rate
7.15%
Create a Home Valuation Report for This Property
The Home Valuation Report is an in-depth analysis detailing your home's value as well as a comparison with similar homes in the area
Home Values in the Area
Average Home Value in this Area
Purchase History
| Date | Buyer | Sale Price | Title Company |
|---|---|---|---|
| Ramos Rivera Gabriel Soto | -- | Lawyers Title | |
| Soto Gabriel | -- | Gateway Title Company | |
| Soto Gabriel | $150,000 | Gateway Title Company |
Source: Public Records
Mortgage History
| Date | Status | Borrower | Loan Amount |
|---|---|---|---|
| Open | Ramos Rivera Gabriel Soto | $160,000 | |
| Closed | Soto Gabriel | $157,000 | |
| Previous Owner | Soto Gabriel | $145,500 |
Source: Public Records
Tax History Compared to Growth
Tax History
| Year | Tax Paid | Tax Assessment Tax Assessment Total Assessment is a certain percentage of the fair market value that is determined by local assessors to be the total taxable value of land and additions on the property. | Land | Improvement |
|---|---|---|---|---|
| 2025 | $3,137 | $233,735 | $115,258 | $118,477 |
| 2024 | $3,137 | $229,153 | $112,999 | $116,154 |
| 2023 | $3,075 | $224,661 | $110,784 | $113,877 |
| 2022 | $3,024 | $220,257 | $108,612 | $111,645 |
| 2021 | $2,951 | $215,939 | $106,483 | $109,456 |
| 2020 | $2,940 | $213,726 | $105,392 | $108,334 |
| 2019 | $3,005 | $209,536 | $103,326 | $106,210 |
| 2018 | $2,714 | $205,428 | $101,300 | $104,128 |
| 2016 | $2,540 | $197,453 | $97,367 | $100,086 |
| 2015 | $2,517 | $194,488 | $95,905 | $98,583 |
| 2014 | $2,504 | $190,679 | $94,027 | $96,652 |
Source: Public Records
Map
Nearby Homes
- 1748 S Huntington St
- 981 Rodeo Rd
- 984 Fremont St
- 11 Rising Hill Rd
- 123 Colorado St
- 26 Viewpoint Cir
- 19 Viewpoint Cir
- 1626 Calatina Dr
- 1425 S White Ave Unit A
- 1423 S Hamilton Blvd Unit 1425
- 1337 Clovis Ct
- 4 Turn Post Ln
- 225 W Franklin Ave
- 647 Muir Ave
- 1356 S White Ave
- 1601 S Garey Ave Unit 93
- 19 Black Oak Dr
- 1261 W Fernleaf Ave
- 130 Ashbrook Ln
- 130 Colorado
- 1852 Garland St
- 1855 Morrison St
- 1847 Morrison St
- 1844 Garland St
- 954 Dayton Ave
- 942 Dayton Ave
- 962 Dayton Ave
- 1835 Morrison St
- 1859 Garland St
- 1853 Garland St
- 938 Dayton Ave
- 1838 Garland St
- 970 Dayton Ave
- 1845 Garland St
- 1827 Morrison St
- 982 Dayton Ave
- 1839 Garland St
- 951 W Lexington Ave
- 957 W Lexington Ave
- 1826 Garland St