1858 Hartman Ln Petaluma, CA 94954
College Heights NeighborhoodEstimated Value: $940,000 - $1,033,000
3
Beds
2
Baths
1,639
Sq Ft
$602/Sq Ft
Est. Value
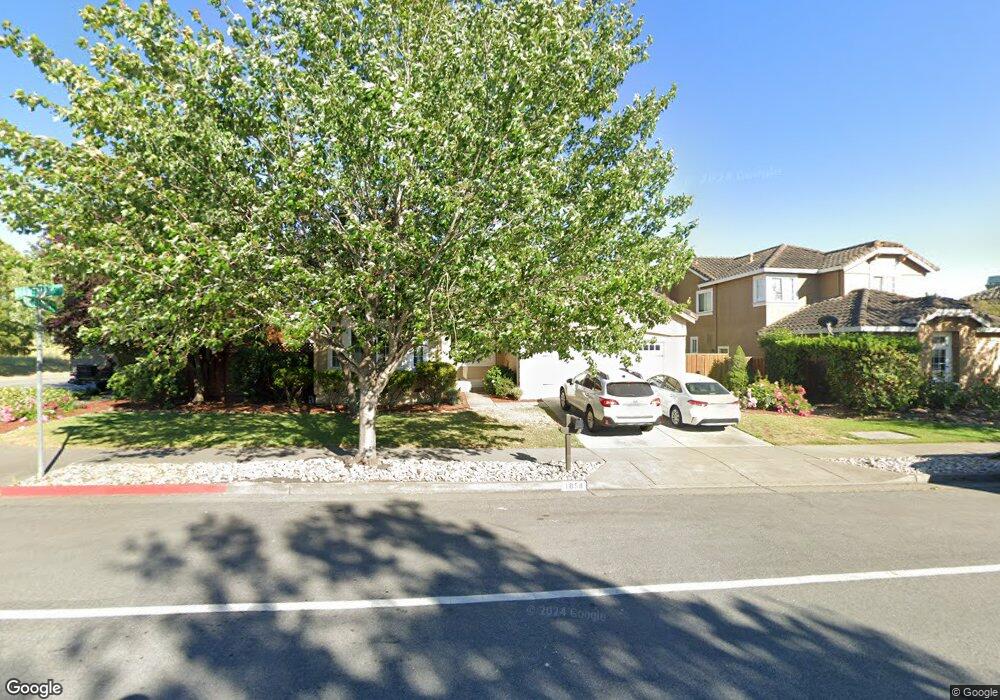
About This Home
This home is located at 1858 Hartman Ln, Petaluma, CA 94954 and is currently estimated at $986,101, approximately $601 per square foot. 1858 Hartman Ln is a home located in Sonoma County with nearby schools including Corona Creek Elementary School, Kenilworth Junior High School, and Casa Grande High School.
Ownership History
Date
Name
Owned For
Owner Type
Purchase Details
Closed on
Mar 1, 2017
Sold by
Murphy Martin J and Murphy Cheryl A
Bought by
Misakian Nicholas and Misakian Lindsay
Current Estimated Value
Home Financials for this Owner
Home Financials are based on the most recent Mortgage that was taken out on this home.
Original Mortgage
$544,000
Outstanding Balance
$451,114
Interest Rate
4.17%
Mortgage Type
New Conventional
Estimated Equity
$534,987
Purchase Details
Closed on
Dec 11, 2002
Sold by
Murphy Martin J and Murphy Cheryl A
Bought by
Murphy Martin J and Murphy Cheryl A
Home Financials for this Owner
Home Financials are based on the most recent Mortgage that was taken out on this home.
Original Mortgage
$186,500
Interest Rate
6.03%
Purchase Details
Closed on
May 5, 1997
Sold by
Mcbail Company
Bought by
Murphy Martin J and Demaranville Cheryl
Home Financials for this Owner
Home Financials are based on the most recent Mortgage that was taken out on this home.
Original Mortgage
$194,400
Interest Rate
7.98%
Create a Home Valuation Report for This Property
The Home Valuation Report is an in-depth analysis detailing your home's value as well as a comparison with similar homes in the area
Home Values in the Area
Average Home Value in this Area
Purchase History
| Date | Buyer | Sale Price | Title Company |
|---|---|---|---|
| Misakian Nicholas | $680,000 | Fidelity National Title Co | |
| Murphy Martin J | -- | North American Title Co | |
| Murphy Martin J | $243,000 | Old Republic Title Company |
Source: Public Records
Mortgage History
| Date | Status | Borrower | Loan Amount |
|---|---|---|---|
| Open | Misakian Nicholas | $544,000 | |
| Previous Owner | Murphy Martin J | $186,500 | |
| Previous Owner | Murphy Martin J | $194,400 |
Source: Public Records
Tax History Compared to Growth
Tax History
| Year | Tax Paid | Tax Assessment Tax Assessment Total Assessment is a certain percentage of the fair market value that is determined by local assessors to be the total taxable value of land and additions on the property. | Land | Improvement |
|---|---|---|---|---|
| 2025 | $8,587 | $789,191 | $315,675 | $473,516 |
| 2024 | $8,587 | $773,718 | $309,486 | $464,232 |
| 2023 | $8,587 | $758,548 | $303,418 | $455,130 |
| 2022 | $8,404 | $743,675 | $297,469 | $446,206 |
| 2021 | $8,223 | $729,094 | $291,637 | $437,457 |
| 2020 | $8,284 | $721,619 | $288,647 | $432,972 |
| 2019 | $8,180 | $707,471 | $282,988 | $424,483 |
| 2018 | $8,179 | $693,600 | $277,440 | $416,160 |
| 2017 | $4,227 | $334,313 | $123,818 | $210,495 |
| 2016 | $4,106 | $327,759 | $121,391 | $206,368 |
| 2015 | $4,080 | $322,837 | $119,568 | $203,269 |
| 2014 | $4,046 | $316,514 | $117,226 | $199,288 |
Source: Public Records
Map
Nearby Homes
- 1757 Burgundy Ct
- 837 Vineyard Place
- 365 Ely Rd N
- 1418 Mauro Pietro Dr Unit 301
- 1660 Old Adobe Rd
- 288 Ely Rd N
- 1544 Crown Rd
- 1548 Royal Oak Dr
- 829 Winton Dr
- 1463 Woodside Cir
- 594 Sonoma Dr
- 20 E Napa Dr
- 1501 Florence Way
- 1441 Woodside Cir
- 36 N Napa Dr
- 518 Vina Rose Dr
- 1003 Sonoma Ct
- 1407 Woodside Cir
- 116 Marvin Ct
- 628 Nikki Dr
- 1854 Hartman Ln
- 925 Riesling Rd
- 1850 Hartman Ln
- 994 Quarry St
- 990 Quarry St
- 921 Riesling Rd
- 1846 Hartman Ln
- 986 Quarry St
- 1901 Spencer Way
- 1842 Hartman Ln
- 993 Quarry St
- 982 Quarry St
- 989 Quarry St
- 1843 Hartman Ln
- 1838 Hartman Ln
- 985 Quarry St
- 1839 Hartman Ln
- 978 Quarry St
- 1902 Spencer Way
- 1834 Hartman Ln