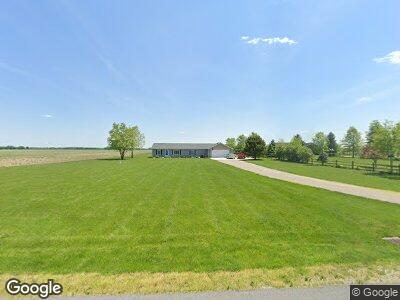
18582 Weston Rd Grand Rapids, OH 43522
Estimated Value: $183,000 - $280,000
3
Beds
2
Baths
1,620
Sq Ft
$144/Sq Ft
Est. Value
About This Home
This home is located at 18582 Weston Rd, Grand Rapids, OH 43522 and is currently estimated at $232,667, approximately $143 per square foot. 18582 Weston Rd is a home located in Wood County with nearby schools including Otsego Elementary School, Otsego Junior High School, and Otsego High School.
Ownership History
Date
Name
Owned For
Owner Type
Purchase Details
Closed on
May 6, 2010
Sold by
Federal Home Loan Mortgage Corporation
Bought by
Beyer Chad
Current Estimated Value
Home Financials for this Owner
Home Financials are based on the most recent Mortgage that was taken out on this home.
Original Mortgage
$71,575
Interest Rate
4.97%
Mortgage Type
FHA
Purchase Details
Closed on
Feb 8, 2010
Sold by
Fry Randy J
Bought by
Federal Home Loan Mortgage Corp
Purchase Details
Closed on
Sep 27, 2002
Sold by
Caple Carol A
Bought by
Fry Randy J and Fry Vicki A
Home Financials for this Owner
Home Financials are based on the most recent Mortgage that was taken out on this home.
Original Mortgage
$124,536
Interest Rate
6.34%
Mortgage Type
Purchase Money Mortgage
Purchase Details
Closed on
Dec 27, 1989
Bought by
Caple Carol A
Create a Home Valuation Report for This Property
The Home Valuation Report is an in-depth analysis detailing your home's value as well as a comparison with similar homes in the area
Home Values in the Area
Average Home Value in this Area
Purchase History
| Date | Buyer | Sale Price | Title Company |
|---|---|---|---|
| Beyer Chad | $80,000 | Attorney | |
| Federal Home Loan Mortgage Corp | $68,000 | None Available | |
| Caple Carol A | -- | -- |
Source: Public Records
Mortgage History
| Date | Status | Borrower | Loan Amount |
|---|---|---|---|
| Open | Beeyr Chad | $98,400 | |
| Closed | Beyer Chad M | $69,000 | |
| Previous Owner | Beyer Chad | $71,575 | |
| Previous Owner | Fry Randy J | $10,742 | |
| Previous Owner | Fry Randy J | $136,500 | |
| Previous Owner | Fry Randy J | $129,527 | |
| Previous Owner | Fry Randy J | $124,536 |
Source: Public Records
Tax History Compared to Growth
Tax History
| Year | Tax Paid | Tax Assessment Tax Assessment Total Assessment is a certain percentage of the fair market value that is determined by local assessors to be the total taxable value of land and additions on the property. | Land | Improvement |
|---|---|---|---|---|
| 2023 | $2,991 | $70,990 | $27,270 | $43,720 |
| 2021 | $2,561 | $55,240 | $17,960 | $37,280 |
| 2020 | $2,575 | $55,240 | $17,960 | $37,280 |
| 2019 | $2,372 | $49,530 | $16,450 | $33,080 |
| 2018 | $2,376 | $49,530 | $16,450 | $33,080 |
| 2017 | $2,323 | $49,530 | $16,450 | $33,080 |
| 2016 | $1,917 | $41,940 | $14,250 | $27,690 |
| 2015 | $1,917 | $39,310 | $14,250 | $25,060 |
| 2014 | $1,719 | $37,770 | $14,250 | $23,520 |
| 2013 | $1,781 | $35,980 | $13,580 | $22,400 |
Source: Public Records
Map
Nearby Homes
- 19788 Otsego Pike
- 12535 S River Rd
- 0 Kellogg Rd Unit 6125521
- 0 Manore Lot A Rd Unit 6123556
- 0 Manore Lot B Rd Unit 6123557
- 12701 S River Rd
- 22888 Wintergreen Rd
- 10325 Bailey Rd
- 17345 Reams Rd
- 24269 W Second St
- 0 Wall St
- 24423 W Second St
- 0 Otsego Pike Unit 6121974
- 24537 W 3rd St
- 24557 W 3rd St
- 24577 W 3rd St
- 0 Jeffers Rd
- 14235 S River Rd
- 9100 Prov Neap Swan Rd
- 16896 Long Judson Rd