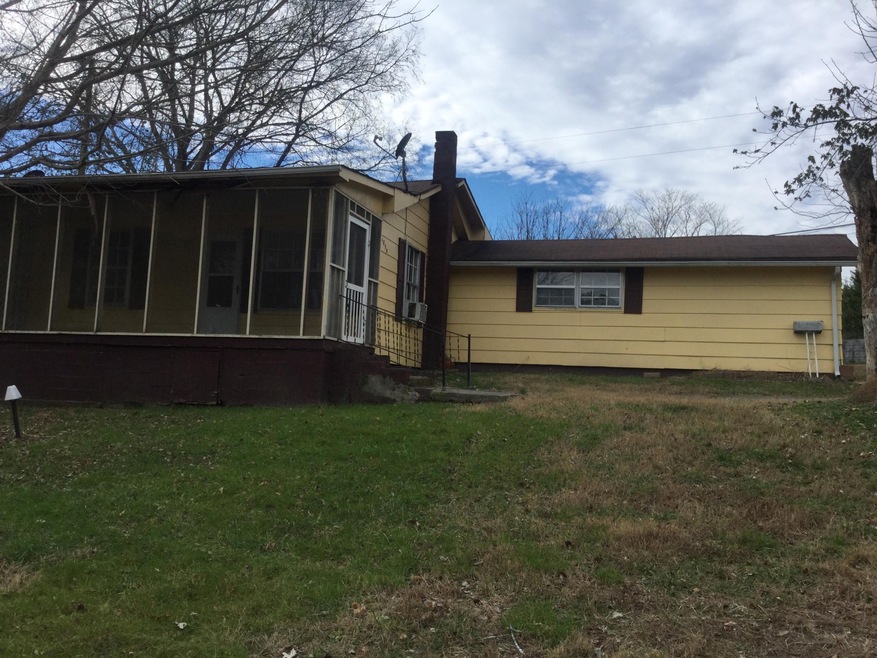
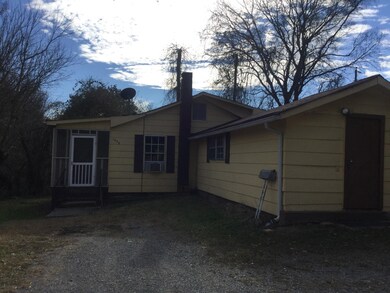
1859 N Highway 341 Rossville, GA 30741
Estimated Value: $141,000 - $210,000
Highlights
- Open Floorplan
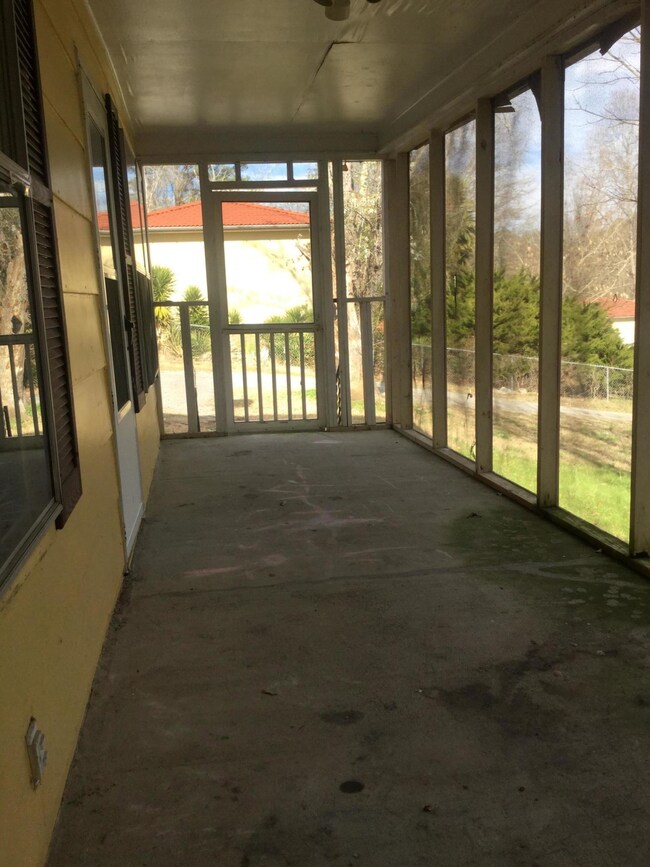
- Porch
- ENERGY STAR Qualified Windows
- No HOA
- Cooling System Mounted To A Wall/Window
- Carpet
About This Home
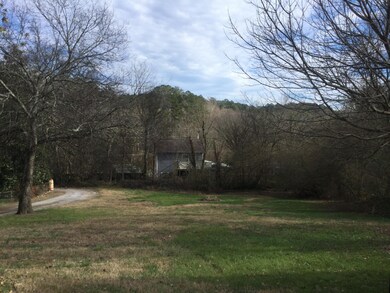
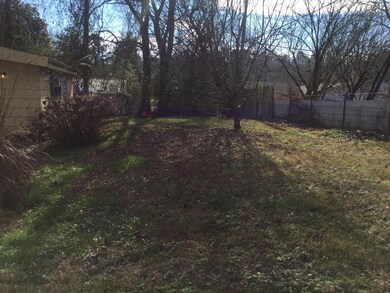
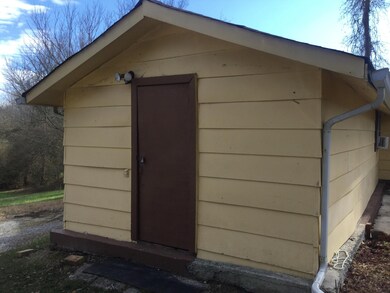
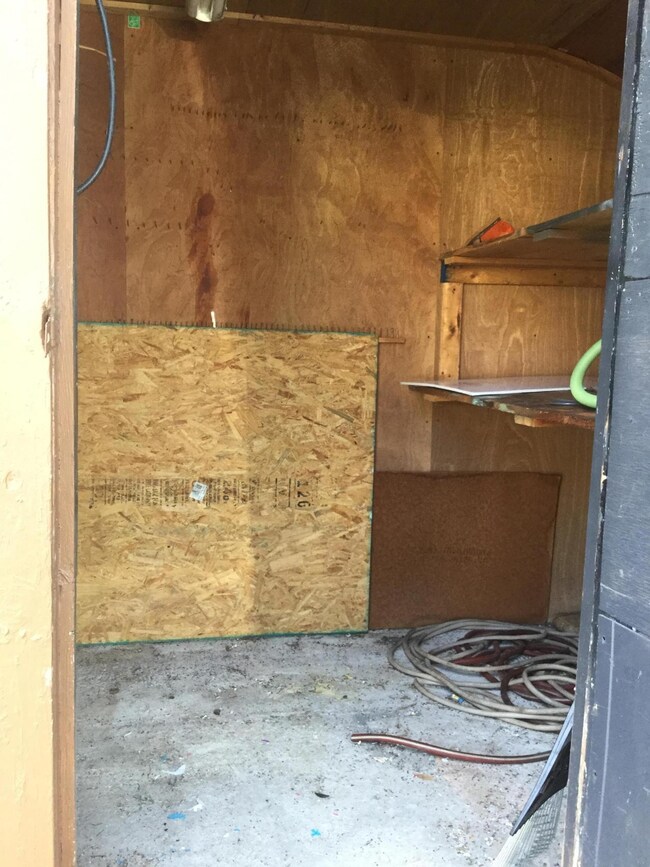
As of January 2021Here is a great opportunity in the Rossville/Chickamauga area. This is a two bedroom one bath handy man special. This home would make a great starter home or a great investment property. It is semi private with a large front yard, nice front porch along with a concrete back patio and a storage unit on the end of the house. The home is on sewer.This home needs some work, but priced accordingly. Home is being sold as is. Buyer to verify all information including but not limited to school zones.
Home Details
Home Type
- Single Family
Est. Annual Taxes
- $603
Year Built
- Built in 1931
Lot Details
- 0.5 Acre Lot
- Lot Dimensions are 105x196x106x201
Home Design
- Asphalt Roof
Interior Spaces
- 1,311 Sq Ft Home
- Property has 1 Level
- Open Floorplan
- ENERGY STAR Qualified Windows
- Carpet
- Crawl Space
- Fire and Smoke Detector
- Dishwasher
- Washer and Gas Dryer Hookup
Bedrooms and Bathrooms
- 2 Bedrooms
- 1 Full Bathroom
Outdoor Features
- Porch
Schools
- Cherokee Ridge Elementary School
- Rossville Middle School
- Ridgeland High School
Utilities
- Cooling System Mounted To A Wall/Window
- Heating System Uses Propane
Community Details
- No Home Owners Association
Listing and Financial Details
- Assessor Parcel Number 0109 017
Ownership History
Purchase Details
Home Financials for this Owner
Home Financials are based on the most recent Mortgage that was taken out on this home.Purchase Details
Purchase Details
Home Values in the Area
Average Home Value in this Area
Purchase History
| Date | Buyer | Sale Price | Title Company |
|---|---|---|---|
| Clark Denny R | $60,000 | -- | |
| Quinn Charlotte | $53,000 | -- | |
| Price Betty Allen K | -- | -- | |
| Price Betty A | -- | -- |
Property History
| Date | Event | Price | List to Sale | Price per Sq Ft |
|---|---|---|---|---|
| 01/21/2021 01/21/21 | Sold | $60,000 | -4.6% | $46 / Sq Ft |
| 01/04/2021 01/04/21 | Pending | -- | -- | -- |
| 12/30/2020 12/30/20 | For Sale | $62,900 | -- | $48 / Sq Ft |
Tax History Compared to Growth
Tax History
| Year | Tax Paid | Tax Assessment Tax Assessment Total Assessment is a certain percentage of the fair market value that is determined by local assessors to be the total taxable value of land and additions on the property. | Land | Improvement |
|---|---|---|---|---|
| 2024 | $1,184 | $51,250 | $8,064 | $43,186 |
| 2023 | $1,139 | $48,120 | $7,200 | $40,920 |
| 2022 | $642 | $38,017 | $3,257 | $34,760 |
| 2021 | $813 | $26,533 | $3,257 | $23,276 |
| 2020 | $722 | $22,150 | $3,257 | $18,893 |
| 2019 | $734 | $22,150 | $3,257 | $18,893 |
| 2018 | $586 | $22,150 | $3,257 | $18,893 |
| 2017 | $795 | $22,150 | $3,257 | $18,893 |
| 2016 | $701 | $23,331 | $3,257 | $20,074 |
| 2015 | $649 | $21,934 | $2,828 | $19,106 |
| 2014 | $568 | $21,934 | $2,828 | $19,106 |
| 2013 | -- | $21,934 | $2,828 | $19,106 |
Map
Source: Realtracs
MLS Number: 2722243
APN: 0109-017
Disclaimer: Certain information contained herein is derived from information provided by parties other than Homes.com. All information provided is deemed reliable, but is not guaranteed to be accurate and should be independently verified.
![]() Based on information submitted to the MLS GRID. All data is obtained from various sources and may not have been verified by broker or MLS GRID. Supplied Open House Information is subject to change without notice. All information should be independently reviewed and verified for accuracy. Properties may or may not be listed by the office/agent presenting the information. Some IDX listings have been excluded from this website.
Based on information submitted to the MLS GRID. All data is obtained from various sources and may not have been verified by broker or MLS GRID. Supplied Open House Information is subject to change without notice. All information should be independently reviewed and verified for accuracy. Properties may or may not be listed by the office/agent presenting the information. Some IDX listings have been excluded from this website.
The Digital Millennium Copyright Act of 1998, 17 U.S.C. § 512 (the “DMCA”) provides recourse for copyright owners who believe that material appearing on the Internet infringes their rights under U.S. copyright law. If you believe in good faith that any content or material made available in connection with our website or services infringes your copyright, you (or your agent) may send us a notice requesting that the content or material be removed, or access to it blocked.
Notices must be sent in writing by email to DMCAnotice@MLSGrid.com.
The DMCA requires that your notice of alleged copyright infringement include the following information:
(1) description of the copyrighted work that is the subject of claimed infringement;
(2) description of the alleged infringing content and information sufficient to permit us to locate the content;
(3) contact information for you, including your address, telephone number and email address;
(4) a statement by you that you have a good faith belief that the content in the manner complained of is not authorized by the copyright owner, or its agent, or by the operation of any law;
(5) a statement by you, signed under penalty of perjury, that the information in the notification is accurate and that you have the authority to enforce the copyrights that are claimed to be infringed; and
(6) a physical or electronic signature of the copyright owner or a person authorized to act on the copyright owner’s behalf. Failure to include all of the above information may result in the delay of the processing of your complaint.
- 1343 N Highway 341
- 320 Marble Top Rd
- 413 Harp Switch Rd
- 201 Laurelwood Cir
- 2751 N Highway 341
- 157 W Lewis St
- 780 Marble Top Rd
- 810 Marble Top Rd
- 544 Lail Rd
- 426 Simmons Tawzer Rd
- 1080 Harp Switch Rd
- 503 Sentry Oaks
- 1907 Grand Center Rd
- 932 Johnson Rd
- 1208 Johnson Rd
- 52 Stones River Dr
- 74 Lail Rd
- 378 Sentry Oaks
- 301 Hidden Oaks Dr
- 946 Greenhill Dr
- 87 Malcolm Dr
- 105 Malcolm Dr
- 64 Howard Dr
- 63 Malcolm Dr
- 52 Howard Dr
- 39 Malcolm Dr
- 1891 N Highway 341
- 66 Harp Switch Rd
- 23 Malcolm Dr
- 1909 N Highway 341
- 42 Howard Dr
- 27 Sherry Ln
- 9 Malcolm Dr
- 29 Clara Dr
- 47 Sherry Ln
- 18 Malcolm Dr
- 136 Harp Switch Rd
- 1913 N Highway 341 Hwy
- 110 Malcolm Dr
- 63 Sherry Ln