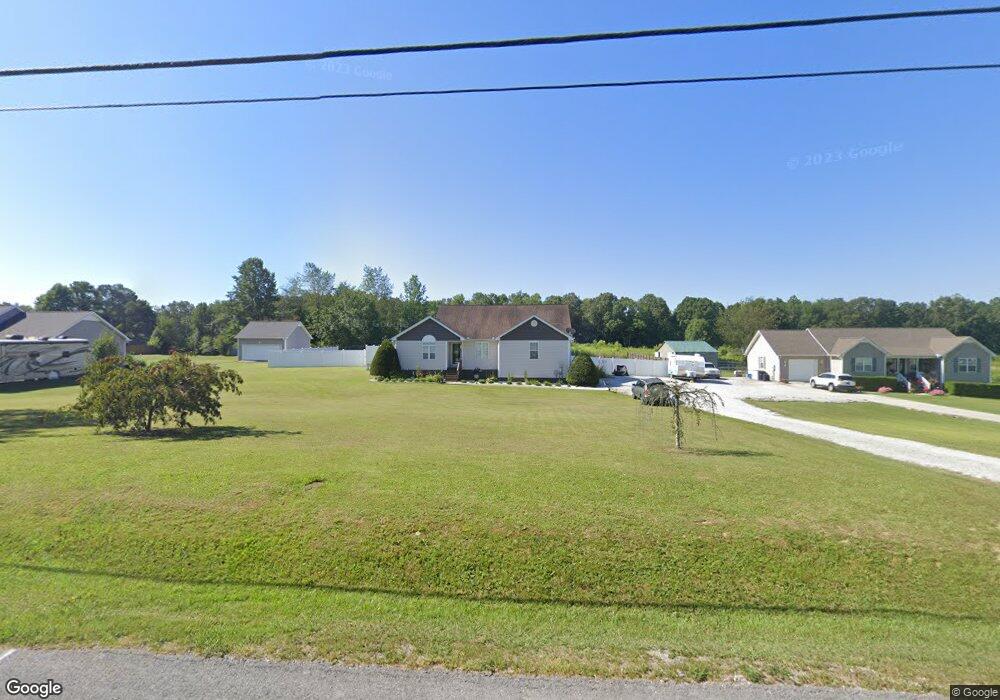
186 Harper Rd Manchester, TN 37355
Estimated Value: $236,000 - $330,000
--
Bed
2
Baths
1,387
Sq Ft
$204/Sq Ft
Est. Value
About This Home
This home is located at 186 Harper Rd, Manchester, TN 37355 and is currently estimated at $283,328, approximately $204 per square foot. 186 Harper Rd is a home located in Coffee County with nearby schools including New Union Elementary School, Coffee County Middle School, and Coffee County Central High School.
Ownership History
Date
Name
Owned For
Owner Type
Purchase Details
Closed on
Dec 9, 2005
Sold by
Ray Matthew
Bought by
Myers Carol A
Current Estimated Value
Home Financials for this Owner
Home Financials are based on the most recent Mortgage that was taken out on this home.
Original Mortgage
$114,741
Outstanding Balance
$63,451
Interest Rate
6.29%
Estimated Equity
$219,877
Purchase Details
Closed on
Dec 7, 2005
Bought by
Myers Carol A Etvir Mark A
Home Financials for this Owner
Home Financials are based on the most recent Mortgage that was taken out on this home.
Original Mortgage
$114,741
Outstanding Balance
$63,451
Interest Rate
6.29%
Estimated Equity
$219,877
Purchase Details
Closed on
Nov 6, 1995
Sold by
Cooper Dale
Bought by
Walker Jimmy and Walker Lesi C
Purchase Details
Closed on
Mar 13, 1995
Bought by
Rapien Len
Create a Home Valuation Report for This Property
The Home Valuation Report is an in-depth analysis detailing your home's value as well as a comparison with similar homes in the area
Home Values in the Area
Average Home Value in this Area
Purchase History
| Date | Buyer | Sale Price | Title Company |
|---|---|---|---|
| Myers Carol A | $115,900 | -- | |
| Myers Carol A Etvir Mark A | $115,900 | -- | |
| Walker Jimmy | $77,900 | -- | |
| Rapien Len | $10,000 | -- |
Source: Public Records
Mortgage History
| Date | Status | Borrower | Loan Amount |
|---|---|---|---|
| Open | Rapien Len | $114,741 | |
| Closed | Rapien Len | $6,954 |
Source: Public Records
Tax History Compared to Growth
Tax History
| Year | Tax Paid | Tax Assessment Tax Assessment Total Assessment is a certain percentage of the fair market value that is determined by local assessors to be the total taxable value of land and additions on the property. | Land | Improvement |
|---|---|---|---|---|
| 2024 | $956 | $41,025 | $6,550 | $34,475 |
| 2023 | $956 | $41,025 | $0 | $0 |
| 2022 | $956 | $41,025 | $6,550 | $34,475 |
| 2021 | $861 | $29,375 | $4,325 | $25,050 |
| 2020 | $861 | $29,375 | $4,325 | $25,050 |
| 2019 | $861 | $29,375 | $4,325 | $25,050 |
| 2018 | $861 | $29,375 | $4,325 | $25,050 |
| 2017 | $905 | $27,725 | $5,100 | $22,625 |
| 2016 | $905 | $27,725 | $5,100 | $22,625 |
| 2015 | $905 | $27,725 | $5,100 | $22,625 |
| 2014 | $904 | $27,720 | $0 | $0 |
Source: Public Records
Map
Nearby Homes
- 1579 Woodbury Hwy
- 2262 Woodbury Hwy
- 163 Stonehenge Ln
- 676 Riddle Rd
- 97 Stonehenge Ln
- 216 Stonehenge Cir
- 110 Phillips Dr
- 67 Stonehenge Ln
- 49 Stonehenge
- 133 Stonehenge Cir
- 153 Stonehenge Cir
- 31 Stonehenge Ln
- 100 Phillips Dr
- 19 Stonehenge
- 58 Stonehenge Ln
- 143 Stonehenge Cir
- 76 Stonehenge Ln N
- 31 Stonehenge Ln S
- 1989 Elevation JKL Plan at Stonehenge
- 1726 Elevation JKL Plan at Stonehenge