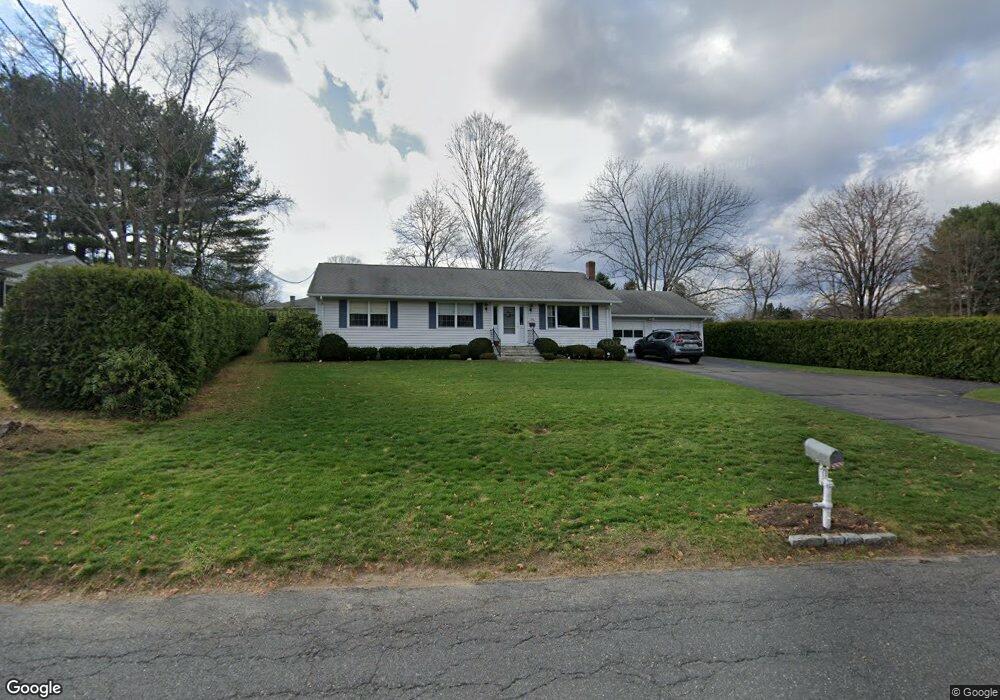
186 Hendrick St Easthampton, MA 01027
Estimated Value: $420,450 - $474,000
3
Beds
2
Baths
1,344
Sq Ft
$327/Sq Ft
Est. Value
About This Home
This home is located at 186 Hendrick St, Easthampton, MA 01027 and is currently estimated at $439,613, approximately $327 per square foot. 186 Hendrick St is a home located in Hampshire County with nearby schools including Easthampton High School, New England Adolescent Research Institute, and Tri-County Schools.
Ownership History
Date
Name
Owned For
Owner Type
Purchase Details
Closed on
Jul 14, 2003
Sold by
Marian Zmaczynski Ft and Zmaczynski Michael J
Bought by
Brown David I and Brown Gwen L
Current Estimated Value
Home Financials for this Owner
Home Financials are based on the most recent Mortgage that was taken out on this home.
Original Mortgage
$45,000
Outstanding Balance
$19,405
Interest Rate
5.45%
Mortgage Type
Purchase Money Mortgage
Estimated Equity
$420,208
Create a Home Valuation Report for This Property
The Home Valuation Report is an in-depth analysis detailing your home's value as well as a comparison with similar homes in the area
Home Values in the Area
Average Home Value in this Area
Purchase History
| Date | Buyer | Sale Price | Title Company |
|---|---|---|---|
| Brown David I | $210,000 | -- |
Source: Public Records
Mortgage History
| Date | Status | Borrower | Loan Amount |
|---|---|---|---|
| Open | Brown David I | $45,000 |
Source: Public Records
Tax History
| Year | Tax Paid | Tax Assessment Tax Assessment Total Assessment is a certain percentage of the fair market value that is determined by local assessors to be the total taxable value of land and additions on the property. | Land | Improvement |
|---|---|---|---|---|
| 2025 | $5,134 | $375,600 | $120,900 | $254,700 |
| 2024 | $4,958 | $365,600 | $117,500 | $248,100 |
| 2023 | $3,728 | $254,500 | $92,500 | $162,000 |
| 2022 | $4,207 | $254,500 | $92,500 | $162,000 |
| 2021 | $4,610 | $262,800 | $92,500 | $170,300 |
| 2020 | $4,520 | $254,500 | $92,500 | $162,000 |
| 2019 | $3,782 | $244,600 | $92,500 | $152,100 |
| 2018 | $3,616 | $226,000 | $87,200 | $138,800 |
| 2017 | $3,529 | $217,700 | $83,800 | $133,900 |
| 2016 | $3,394 | $217,700 | $83,800 | $133,900 |
| 2015 | $3,298 | $217,700 | $83,800 | $133,900 |
Source: Public Records
Map
Nearby Homes
- 29 Sandra Rd
- 4 Laurel Dr
- 36 & 36R Holly Cir
- 245 Park St
- 36 Line St
- 1 Plain St
- 2 W Park Dr
- 7 Western View Rd
- 95 Gunn Rd
- 6 S St & Abutting Lots
- 41 South St Unit 11
- 19 Mount Tom Ave Unit 19
- Lot 3 Mountain Rd
- 2 Oak St
- 19 Nicols Way Unit 19
- 48 Gunn Rd
- 33 Knipfer Ave
- 385 Main St
- 154 Madison Ave
- 38 College Hwy
Your Personal Tour Guide
Ask me questions while you tour the home.