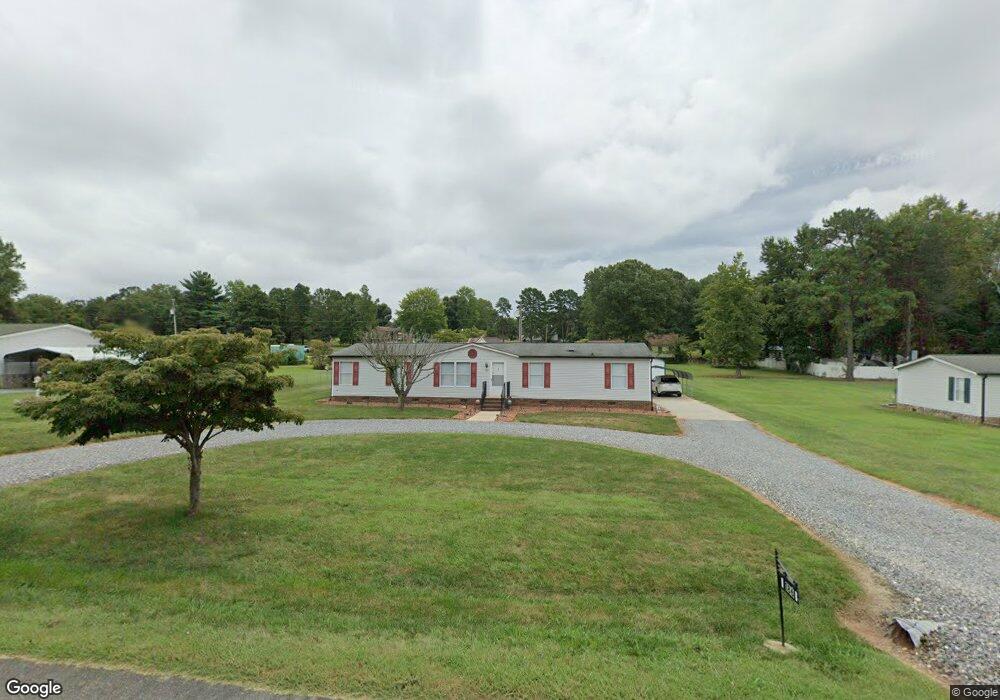
186 James St Lincolnton, NC 28092
Estimated Value: $213,000 - $267,000
4
Beds
2
Baths
1,944
Sq Ft
$120/Sq Ft
Est. Value
About This Home
This home is located at 186 James St, Lincolnton, NC 28092 and is currently estimated at $234,000, approximately $120 per square foot. 186 James St is a home located in Lincoln County with nearby schools including Iron Station Elementary School, North Lincoln Middle School, and North Lincoln High School.
Ownership History
Date
Name
Owned For
Owner Type
Purchase Details
Closed on
Feb 5, 2020
Sold by
Gaston Andrea and Gaston Gary
Bought by
Morrison Jessie Franklin and Morrison Dorthea Helms
Current Estimated Value
Purchase Details
Closed on
May 6, 2019
Sold by
Morrison Eddie Farnklin
Bought by
Helms Morrison Jessie Franklin and Helms Morrison Dorthea
Purchase Details
Closed on
Feb 22, 2012
Sold by
Morrison Jesse F and Morrison Dorothea H
Bought by
Morrison Eddie Franklin
Purchase Details
Closed on
Jun 2, 2000
Bought by
Morrison Jessie Franklin and Morrison Dorothe
Purchase Details
Closed on
Mar 3, 2000
Bought by
The Bank Of New York (Trustee Amresco Re
Purchase Details
Closed on
Jul 9, 1993
Bought by
Nickens Gary Ray
Purchase Details
Closed on
Jul 24, 1992
Bought by
Heafner William L and Heafner Debra D
Create a Home Valuation Report for This Property
The Home Valuation Report is an in-depth analysis detailing your home's value as well as a comparison with similar homes in the area
Home Values in the Area
Average Home Value in this Area
Purchase History
| Date | Buyer | Sale Price | Title Company |
|---|---|---|---|
| Morrison Jessie Franklin | -- | None Available | |
| Helms Morrison Jessie Franklin | -- | None Available | |
| Morrison Eddie Franklin | -- | None Available | |
| Morrison Jessie Franklin | $70,900 | -- | |
| The Bank Of New York (Trustee Amresco Re | $73,500 | -- | |
| Nickens Gary Ray | $9,000 | -- | |
| Heafner William L | $63,000 | -- |
Source: Public Records
Tax History Compared to Growth
Tax History
| Year | Tax Paid | Tax Assessment Tax Assessment Total Assessment is a certain percentage of the fair market value that is determined by local assessors to be the total taxable value of land and additions on the property. | Land | Improvement |
|---|---|---|---|---|
| 2025 | $952 | $130,185 | $26,000 | $104,185 |
| 2024 | $932 | $130,185 | $26,000 | $104,185 |
| 2023 | $927 | $130,185 | $26,000 | $104,185 |
| 2022 | $744 | $84,482 | $21,000 | $63,482 |
| 2021 | $744 | $84,482 | $21,000 | $63,482 |
| 2020 | $612 | $84,482 | $21,000 | $63,482 |
| 2019 | $595 | $84,482 | $21,000 | $63,482 |
| 2018 | $732 | $85,906 | $20,000 | $65,906 |
| 2017 | $611 | $85,906 | $20,000 | $65,906 |
| 2016 | $611 | $85,906 | $20,000 | $65,906 |
| 2015 | $679 | $85,066 | $20,000 | $65,066 |
| 2014 | $660 | $83,661 | $21,000 | $62,661 |
Source: Public Records
Map
Nearby Homes
- 2984 N Carolina 27
- 2515 Myra Ln
- 370 Sherrill Farm Rd
- 2384 Abby Ave
- 2546 N Carolina Highway 150
- 663-A Way
- 741 Sunridge Dr
- 312 Shady Ln
- 000 Curveview Rd
- 575 Hill Rd
- 2109 Boggs St
- 1195 Ralph B Keener Rd
- 0 Andrew Link Rd
- 00 Turner St
- 1471 Arden Dr
- 1335 Huckleberry Dr
- 2671 Surrey Dr
- 222 McMillian Heights Rd
- 1681 Woolie Rd
- 2914 Weatherfield Dr