186 Marsden St Unit 188 Springfield, MA 01109
Pine Point NeighborhoodEstimated Value: $322,819 - $393,000
7
Beds
2
Baths
1,988
Sq Ft
$178/Sq Ft
Est. Value
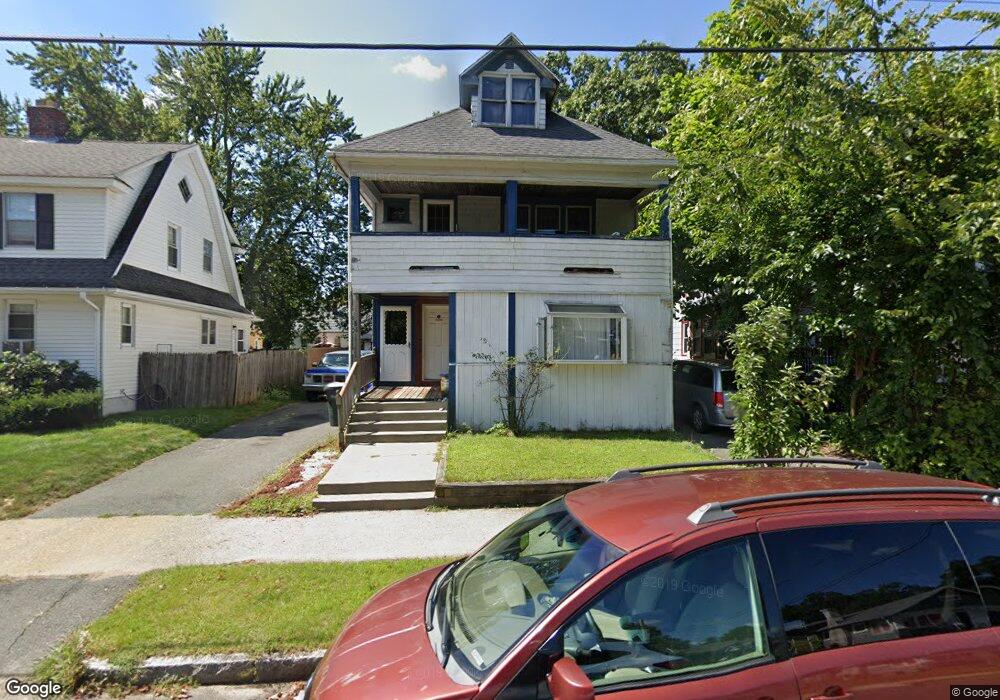
About This Home
This home is located at 186 Marsden St Unit 188, Springfield, MA 01109 and is currently estimated at $354,705, approximately $178 per square foot. 186 Marsden St Unit 188 is a home located in Hampden County with nearby schools including Hiram L. Dorman Elementary, John F. Kennedy Academy, and Springfield Central High School.
Ownership History
Date
Name
Owned For
Owner Type
Purchase Details
Closed on
Nov 25, 2013
Sold by
Giordano Val P and Giordano Cheryl A
Bought by
Giordano Val P and Giordano Cheryl
Current Estimated Value
Purchase Details
Closed on
Jul 11, 2006
Sold by
Giordano Joseph J and Giordano Val P
Bought by
Giordano Cheryl and Giordano Val P
Purchase Details
Closed on
Apr 14, 2003
Sold by
Giordano Joseph J and Giordano Val P
Bought by
Giordano Cheryl A and Parent Janice
Create a Home Valuation Report for This Property
The Home Valuation Report is an in-depth analysis detailing your home's value as well as a comparison with similar homes in the area
Home Values in the Area
Average Home Value in this Area
Purchase History
| Date | Buyer | Sale Price | Title Company |
|---|---|---|---|
| Giordano Val P | -- | -- | |
| Giordano Cheryl | -- | -- | |
| Giordano Cheryl A | -- | -- |
Source: Public Records
Tax History Compared to Growth
Tax History
| Year | Tax Paid | Tax Assessment Tax Assessment Total Assessment is a certain percentage of the fair market value that is determined by local assessors to be the total taxable value of land and additions on the property. | Land | Improvement |
|---|---|---|---|---|
| 2025 | $4,680 | $298,500 | $39,000 | $259,500 |
| 2024 | $4,319 | $268,900 | $32,500 | $236,400 |
| 2023 | $4,160 | $244,000 | $29,600 | $214,400 |
| 2022 | $3,533 | $187,700 | $27,600 | $160,100 |
| 2021 | $3,387 | $179,200 | $25,200 | $154,000 |
| 2020 | $3,123 | $159,900 | $25,200 | $134,700 |
| 2019 | $3,082 | $156,600 | $25,200 | $131,400 |
| 2018 | $2,958 | $150,300 | $25,200 | $125,100 |
| 2017 | $2,931 | $149,100 | $23,200 | $125,900 |
| 2016 | $2,684 | $136,500 | $23,200 | $113,300 |
| 2015 | $2,663 | $135,400 | $23,200 | $112,200 |
Source: Public Records
Map
Nearby Homes