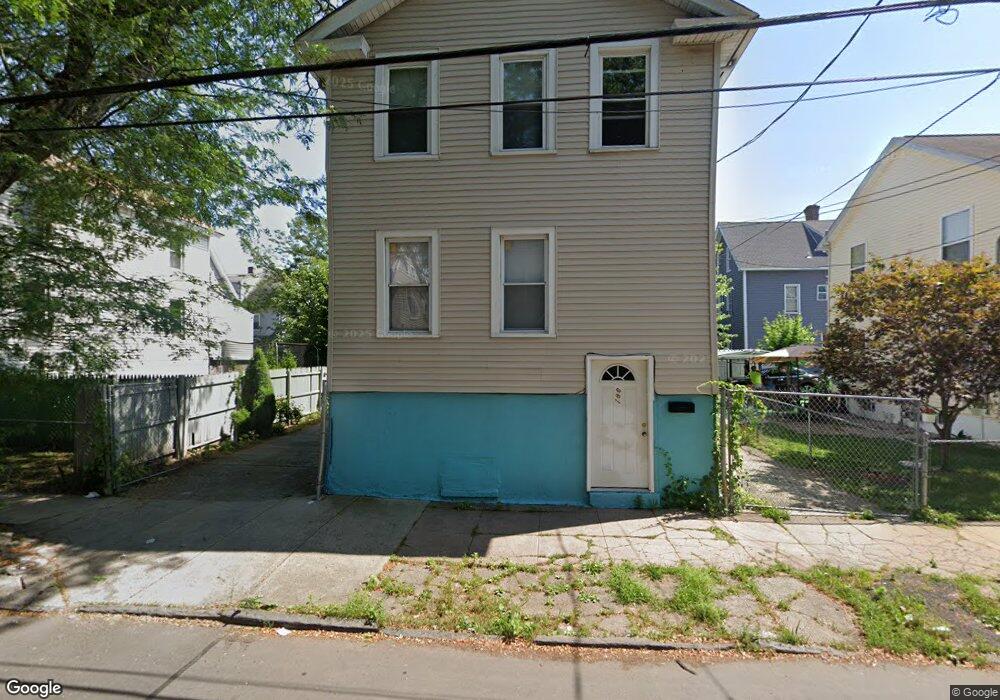
186 Pine St New Haven, CT 06513
Fair Haven NeighborhoodEstimated Value: $243,000 - $405,000
4
Beds
2
Baths
1,600
Sq Ft
$202/Sq Ft
Est. Value
About This Home
This home is located at 186 Pine St, New Haven, CT 06513 and is currently estimated at $323,243, approximately $202 per square foot. 186 Pine St is a home located in New Haven County with nearby schools including Clinton Avenue School, Elm City College Preparatory School, and Cold Spring School.
Ownership History
Date
Name
Owned For
Owner Type
Purchase Details
Closed on
Jan 27, 2023
Sold by
Jiminez Ruddy R
Bought by
Cuevas Kenia
Current Estimated Value
Home Financials for this Owner
Home Financials are based on the most recent Mortgage that was taken out on this home.
Original Mortgage
$166,920
Outstanding Balance
$161,664
Interest Rate
6.31%
Mortgage Type
FHA
Estimated Equity
$161,579
Purchase Details
Closed on
Jul 12, 2005
Sold by
Rispoli Jennifer
Bought by
Jiminez Ruddy R
Home Financials for this Owner
Home Financials are based on the most recent Mortgage that was taken out on this home.
Original Mortgage
$114,400
Interest Rate
5.71%
Purchase Details
Closed on
Feb 26, 2003
Sold by
New Haven City Of
Bought by
Rispoli Jennifer
Create a Home Valuation Report for This Property
The Home Valuation Report is an in-depth analysis detailing your home's value as well as a comparison with similar homes in the area
Home Values in the Area
Average Home Value in this Area
Purchase History
| Date | Buyer | Sale Price | Title Company |
|---|---|---|---|
| Cuevas Kenia | $170,000 | None Available | |
| Jiminez Ruddy R | $143,000 | -- | |
| Rispoli Jennifer | $5,000 | -- |
Source: Public Records
Mortgage History
| Date | Status | Borrower | Loan Amount |
|---|---|---|---|
| Open | Cuevas Kenia | $166,920 | |
| Previous Owner | Rispoli Jennifer | $160,500 | |
| Previous Owner | Rispoli Jennifer | $175,000 | |
| Previous Owner | Rispoli Jennifer | $114,400 |
Source: Public Records
Tax History
| Year | Tax Paid | Tax Assessment Tax Assessment Total Assessment is a certain percentage of the fair market value that is determined by local assessors to be the total taxable value of land and additions on the property. | Land | Improvement |
|---|---|---|---|---|
| 2025 | $5,328 | $135,240 | $44,730 | $90,510 |
| 2024 | $5,207 | $135,240 | $44,730 | $90,510 |
| 2023 | $5,031 | $135,240 | $44,730 | $90,510 |
| 2022 | $5,376 | $135,240 | $44,730 | $90,510 |
| 2021 | $3,483 | $79,380 | $34,440 | $44,940 |
| 2020 | $3,483 | $79,380 | $34,440 | $44,940 |
| 2019 | $3,412 | $79,380 | $34,440 | $44,940 |
| 2018 | $3,412 | $79,380 | $34,440 | $44,940 |
| 2017 | $3,070 | $79,380 | $34,440 | $44,940 |
| 2016 | $2,458 | $59,150 | $21,140 | $38,010 |
| 2015 | $2,458 | $59,150 | $21,140 | $38,010 |
| 2014 | $2,458 | $59,150 | $21,140 | $38,010 |
Source: Public Records
Map
Nearby Homes
Your Personal Tour Guide
Ask me questions while you tour the home.