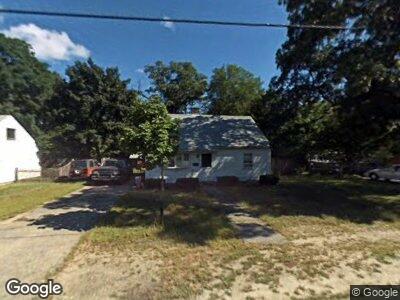
186 Stoughton St Unit 1 Stoughton, MA 02072
Estimated Value: $428,000 - $552,000
2
Beds
1
Bath
720
Sq Ft
$678/Sq Ft
Est. Value
About This Home
This home is located at 186 Stoughton St Unit 1, Stoughton, MA 02072 and is currently estimated at $488,208, approximately $678 per square foot. 186 Stoughton St Unit 1 is a home located in Norfolk County with nearby schools including Wilkins Elementary School, O'Donnell Middle School, and Stoughton High School.
Ownership History
Date
Name
Owned For
Owner Type
Purchase Details
Closed on
Aug 17, 2010
Sold by
Mhfa
Bought by
Riley Donna M
Current Estimated Value
Home Financials for this Owner
Home Financials are based on the most recent Mortgage that was taken out on this home.
Original Mortgage
$133,200
Interest Rate
4.63%
Mortgage Type
Purchase Money Mortgage
Purchase Details
Closed on
Mar 23, 2010
Sold by
Fnma
Bought by
Mhfa
Purchase Details
Closed on
Feb 3, 2010
Sold by
Thomas Jonathan D and Mers
Bought by
Federal National Mortgage Association
Purchase Details
Closed on
Sep 28, 2007
Sold by
Boyle Frederick W and Boyle Monica F
Bought by
Thomas Jonathan D
Home Financials for this Owner
Home Financials are based on the most recent Mortgage that was taken out on this home.
Original Mortgage
$229,000
Interest Rate
6.65%
Mortgage Type
Purchase Money Mortgage
Create a Home Valuation Report for This Property
The Home Valuation Report is an in-depth analysis detailing your home's value as well as a comparison with similar homes in the area
Home Values in the Area
Average Home Value in this Area
Purchase History
| Date | Buyer | Sale Price | Title Company |
|---|---|---|---|
| Riley Donna M | $166,500 | -- | |
| Riley Donna M | $166,500 | -- | |
| Mhfa | -- | -- | |
| Mhfa | -- | -- | |
| Federal National Mortgage Association | $135,000 | -- | |
| Federal National Mortgage Association | $135,000 | -- | |
| Thomas Jonathan D | $229,000 | -- | |
| Thomas Jonathan D | $229,000 | -- |
Source: Public Records
Mortgage History
| Date | Status | Borrower | Loan Amount |
|---|---|---|---|
| Open | Silva Jonatas | $325,000 | |
| Closed | Silva Jonatas | $324,950 | |
| Closed | Teixeira Ruben C | $185,250 | |
| Closed | Riley Donna M | $133,200 | |
| Previous Owner | Thomas Jonathan D | $229,000 |
Source: Public Records
Tax History Compared to Growth
Tax History
| Year | Tax Paid | Tax Assessment Tax Assessment Total Assessment is a certain percentage of the fair market value that is determined by local assessors to be the total taxable value of land and additions on the property. | Land | Improvement |
|---|---|---|---|---|
| 2025 | $4,852 | $391,900 | $210,400 | $181,500 |
| 2024 | $4,674 | $367,200 | $191,700 | $175,500 |
| 2023 | $4,592 | $338,900 | $178,100 | $160,800 |
| 2022 | $4,409 | $306,000 | $162,900 | $143,100 |
| 2021 | $4,204 | $278,400 | $147,600 | $130,800 |
| 2020 | $3,717 | $249,600 | $142,500 | $107,100 |
| 2019 | $3,530 | $230,100 | $142,500 | $87,600 |
| 2018 | $3,140 | $212,000 | $135,700 | $76,300 |
| 2017 | $2,947 | $203,400 | $128,900 | $74,500 |
| 2016 | $2,799 | $187,000 | $118,800 | $68,200 |
| 2015 | $2,807 | $185,500 | $112,000 | $73,500 |
| 2014 | $2,651 | $168,400 | $101,800 | $66,600 |
Source: Public Records
Map
Nearby Homes
- 62 Ralph Mann Dr
- 64 Thomas St
- 545 Pearl St
- 0 Washington St Unit 71897113
- 0 Washington St Unit 73233511
- 0 Washington St Unit 72888098
- 56 Station St
- 350 Cushing St
- 141 Shaw Farm Rd Unit 141
- 18 Darling Way
- 52 Adams St
- 54 Will Dr Unit 87
- 43 Will Dr Unit 30
- 1049 Pleasant St
- 34 Clapp St
- 99 Lincoln St
- 45 Pearl Street Place
- 45 Will Dr Unit 97
- 11 Monk St
- 464 Canton St
- 186 Stoughton St Unit 1
- 186 Stoughton St
- 178 Stoughton St
- 194 Stoughton St
- Lot B Stoughton St
- 170 Stoughton St
- 202 Stoughton St
- 191 Stoughton St
- 183 Stoughton St
- 201 Stoughton St
- 175 Stoughton St
- 164 Stoughton St
- 6 Doty Dr
- 167 Stoughton St
- 140 Ralph Mann Dr
- 212 Stoughton St
- 114 Woodbine Rd
- 156 Stoughton St
- 106 Woodbine Rd
- 215 Stoughton St