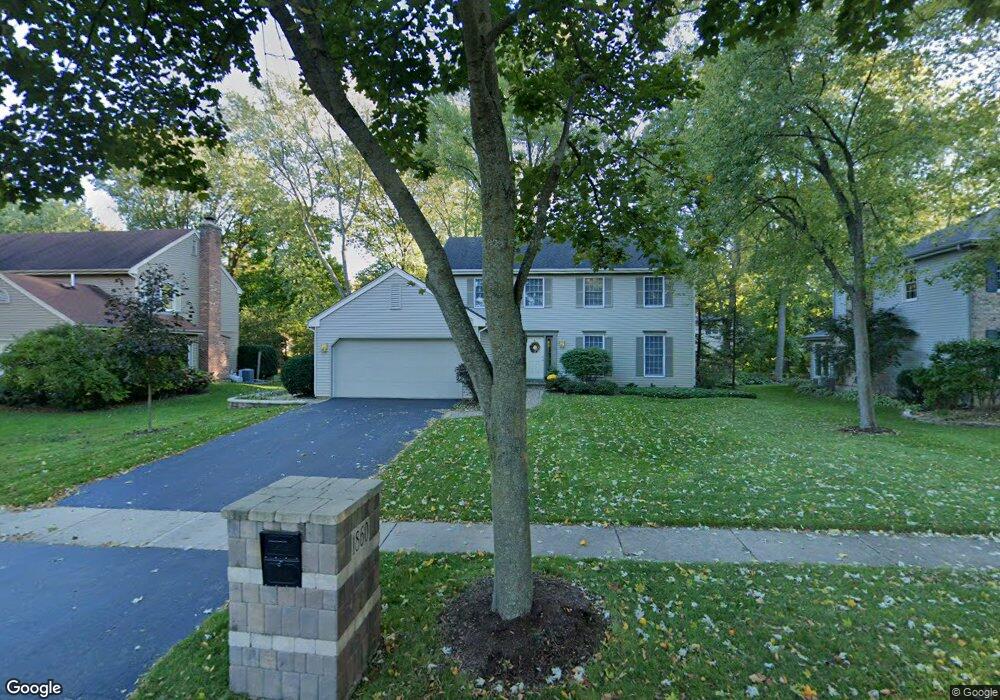
1860 Forest Ridge Rd Unit 2 Saint Charles, IL 60174
Northeast Saint Charles NeighborhoodEstimated Value: $423,000 - $560,000
4
Beds
2
Baths
2,272
Sq Ft
$226/Sq Ft
Est. Value
About This Home
This home is located at 1860 Forest Ridge Rd Unit 2, Saint Charles, IL 60174 and is currently estimated at $513,690, approximately $226 per square foot. 1860 Forest Ridge Rd Unit 2 is a home located in Kane County with nearby schools including Munhall Elementary School, Wredling Middle School, and St Charles East High School.
Ownership History
Date
Name
Owned For
Owner Type
Purchase Details
Closed on
Sep 1, 2017
Sold by
Johnson Linn C
Bought by
Johnson Linn C and The Linn C Johnson Living Trus
Current Estimated Value
Purchase Details
Closed on
Dec 16, 2005
Sold by
Johnson Mark R and Johnson Linn C
Bought by
Johnson Linn C
Purchase Details
Closed on
Aug 13, 1999
Sold by
Morlock Paul J and Morlock Catherine A
Bought by
Johnson Mark R and Johnson Linn E
Home Financials for this Owner
Home Financials are based on the most recent Mortgage that was taken out on this home.
Original Mortgage
$160,000
Outstanding Balance
$45,835
Interest Rate
7.61%
Estimated Equity
$467,855
Purchase Details
Closed on
Nov 21, 1997
Sold by
Lincheck John F and Lincheck Sandra
Bought by
Morlock Paul J and Morlock Catherine A
Home Financials for this Owner
Home Financials are based on the most recent Mortgage that was taken out on this home.
Original Mortgage
$215,200
Interest Rate
7%
Create a Home Valuation Report for This Property
The Home Valuation Report is an in-depth analysis detailing your home's value as well as a comparison with similar homes in the area
Home Values in the Area
Average Home Value in this Area
Purchase History
| Date | Buyer | Sale Price | Title Company |
|---|---|---|---|
| Johnson Linn C | -- | None Available | |
| Johnson Linn C | -- | -- | |
| Johnson Mark R | $280,000 | Chicago Title Insurance Co | |
| Morlock Paul J | $269,000 | -- |
Source: Public Records
Mortgage History
| Date | Status | Borrower | Loan Amount |
|---|---|---|---|
| Open | Johnson Mark R | $160,000 | |
| Previous Owner | Morlock Paul J | $215,200 |
Source: Public Records
Tax History Compared to Growth
Tax History
| Year | Tax Paid | Tax Assessment Tax Assessment Total Assessment is a certain percentage of the fair market value that is determined by local assessors to be the total taxable value of land and additions on the property. | Land | Improvement |
|---|---|---|---|---|
| 2024 | $9,421 | $142,909 | $46,550 | $96,359 |
| 2023 | $9,597 | $127,906 | $41,663 | $86,243 |
| 2022 | $9,692 | $126,035 | $44,271 | $81,764 |
| 2021 | $9,309 | $120,136 | $42,199 | $77,937 |
| 2020 | $9,209 | $117,896 | $41,412 | $76,484 |
| 2019 | $9,043 | $115,562 | $40,592 | $74,970 |
| 2018 | $9,203 | $116,957 | $39,049 | $77,908 |
| 2017 | $8,962 | $112,958 | $37,713 | $75,245 |
| 2016 | $9,409 | $108,990 | $36,388 | $72,602 |
| 2015 | -- | $104,744 | $35,996 | $68,748 |
| 2014 | -- | $101,611 | $35,996 | $65,615 |
| 2013 | -- | $103,340 | $36,356 | $66,984 |
Source: Public Records
Map
Nearby Homes
- 1724 Waverly Cir
- 702 Derby Course
- 0 E Main St
- 21 Southgate Course
- 509 Steeplechase Rd
- 11 Hunt Club Dr Unit 108S
- Lot 4 Mosedale St
- Lot 2 in Block 2 Norway Maple Addition To St Charles
- Lot 1 in Block 2 Norway Maple Addition To St Charles
- 113 Whittington Course
- 503 Cora Ln
- 1568 Dempsey Dr
- 1572 Dempsey Dr
- 1517 Dempsey Dr
- 1501 Dempsey Dr
- 308 S 12th Ave
- 615 Marion Ave
- 1348 Adams Ct
- 1590 Adams Ave
- 730 Stuarts Dr Unit 730
- 1910 Forest Ridge Rd
- 1850 Forest Ridge Rd Unit 2
- 1810 Allen Ln
- 1920 Forest Ridge Rd
- 1840 Forest Ridge Rd Unit 2
- 1816 Allen Ln
- 1804 Allen Ln
- 1855 Forest Ridge Rd
- 1804 Sterling Ct Unit 2
- 1822 Allen Ln Unit 3
- 1728 Allen Ln
- 1930 Forest Ridge Rd
- 1830 Forest Ridge Rd
- 1845 Forest Ridge Rd
- 1925 Forest Ridge Rd Unit 2
- 1828 Allen Ln
- 1808 Sterling Ct
- 1722 Allen Ln
- 1805 Sterling Ct
- 1825 Forest Ridge Rd