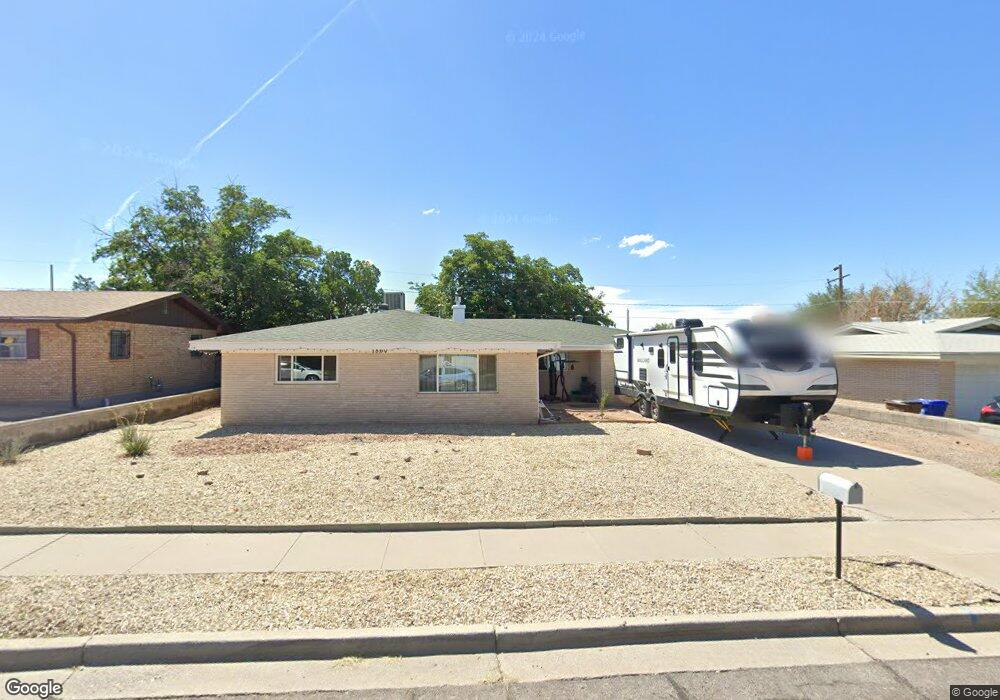
1860 Myrtle Ave Las Cruces, NM 88001
Estimated Value: $238,000 - $251,443
4
Beds
2
Baths
2,372
Sq Ft
$103/Sq Ft
Est. Value
About This Home
This home is located at 1860 Myrtle Ave, Las Cruces, NM 88001 and is currently estimated at $244,722, approximately $103 per square foot. 1860 Myrtle Ave is a home located in Dona Ana County with nearby schools including University Hills Elementary School, Lynn Middle School, and Centennial High School.
Ownership History
Date
Name
Owned For
Owner Type
Purchase Details
Closed on
Aug 8, 2017
Sold by
Libby David L and Libby Nancy M
Bought by
J M H Properties Llc
Current Estimated Value
Purchase Details
Closed on
Mar 21, 2008
Sold by
Libby Nancy M
Bought by
Libby David and Libby Nancy M
Purchase Details
Closed on
Nov 30, 2006
Sold by
Renio Anthony P and Renio Debbie G
Bought by
Libby Nancy M
Home Financials for this Owner
Home Financials are based on the most recent Mortgage that was taken out on this home.
Original Mortgage
$149,000
Interest Rate
6.37%
Mortgage Type
Purchase Money Mortgage
Purchase Details
Closed on
Apr 14, 1999
Sold by
Hull Wendell C and Hull Arlene E
Bought by
Renio Anthony P and Renio Debbie G
Home Financials for this Owner
Home Financials are based on the most recent Mortgage that was taken out on this home.
Original Mortgage
$86,963
Interest Rate
7.06%
Mortgage Type
FHA
Create a Home Valuation Report for This Property
The Home Valuation Report is an in-depth analysis detailing your home's value as well as a comparison with similar homes in the area
Home Values in the Area
Average Home Value in this Area
Purchase History
| Date | Buyer | Sale Price | Title Company |
|---|---|---|---|
| J M H Properties Llc | -- | Southwestern Abstract & Titl | |
| Libby David | -- | None Available | |
| Libby Nancy M | -- | Southwestern Abstract & Titl | |
| Renio Anthony P | -- | Southwestern Abstract & Titl |
Source: Public Records
Mortgage History
| Date | Status | Borrower | Loan Amount |
|---|---|---|---|
| Previous Owner | Libby Nancy M | $149,000 | |
| Previous Owner | Renio Anthony P | $86,963 |
Source: Public Records
Tax History Compared to Growth
Tax History
| Year | Tax Paid | Tax Assessment Tax Assessment Total Assessment is a certain percentage of the fair market value that is determined by local assessors to be the total taxable value of land and additions on the property. | Land | Improvement |
|---|---|---|---|---|
| 2024 | $1,660 | $54,488 | $8,333 | $46,155 |
| 2023 | $1,636 | $52,901 | $8,333 | $44,568 |
| 2022 | $1,611 | $51,360 | $8,333 | $43,027 |
| 2021 | $1,559 | $49,864 | $8,333 | $41,531 |
| 2020 | $1,521 | $48,412 | $8,333 | $40,079 |
| 2019 | $1,481 | $47,002 | $8,333 | $38,669 |
| 2018 | $1,429 | $45,633 | $8,333 | $37,300 |
| 2017 | $797 | $37,739 | $8,333 | $29,406 |
| 2016 | $808 | $37,733 | $8,333 | $29,400 |
| 2015 | $844 | $116,500 | $25,000 | $91,500 |
| 2014 | $817 | $113,712 | $25,750 | $87,962 |
Source: Public Records
Map
Nearby Homes
- 1880 Rentfrow Ave
- 1935 Thomas Dr
- 1630 Wyoming Ave
- 2090 Payne Ct
- 1350 Wofford Dr
- 1423 -1425 Monte Vista Ave
- 1641 Stull Dr
- 1929 Newton St
- 1512 Andrews Dr
- 1868 S Triviz Dr Unit A-B
- 1408 Lees Dr
- 1500 Gladys Dr
- 1825 Chaparro St
- 1609 Stull Dr
- 1509 Stull Dr
- 1782 Pecos St
- 2105 S Espina St
- 2313 Magnolia Dr
- 1928 Princess Jeanne Dr
- 1101 Jett Ave
- 1850 Myrtle Ave
- 1870 Myrtle Ave
- 1865 Rentfrow Ave
- 1845 Rentfrow Ave
- 1840 Myrtle Ave
- 1880 Myrtle Ave
- 1865 Myrtle Ave
- 1875 Myrtle Ave
- 1855 Myrtle Ave
- 1875 Rentfrow Ave
- 1885 Myrtle Ave
- 1835 Rentfrow Ave
- 1830 Myrtle Ave
- 1845 Myrtle Ave
- 1890 Myrtle Ave
- 1850 Rentfrow Ave
- 1885 Rentfrow Ave
- 1860 Anderson Dr
- 1870 Anderson Dr
- 1895 Myrtle Ave