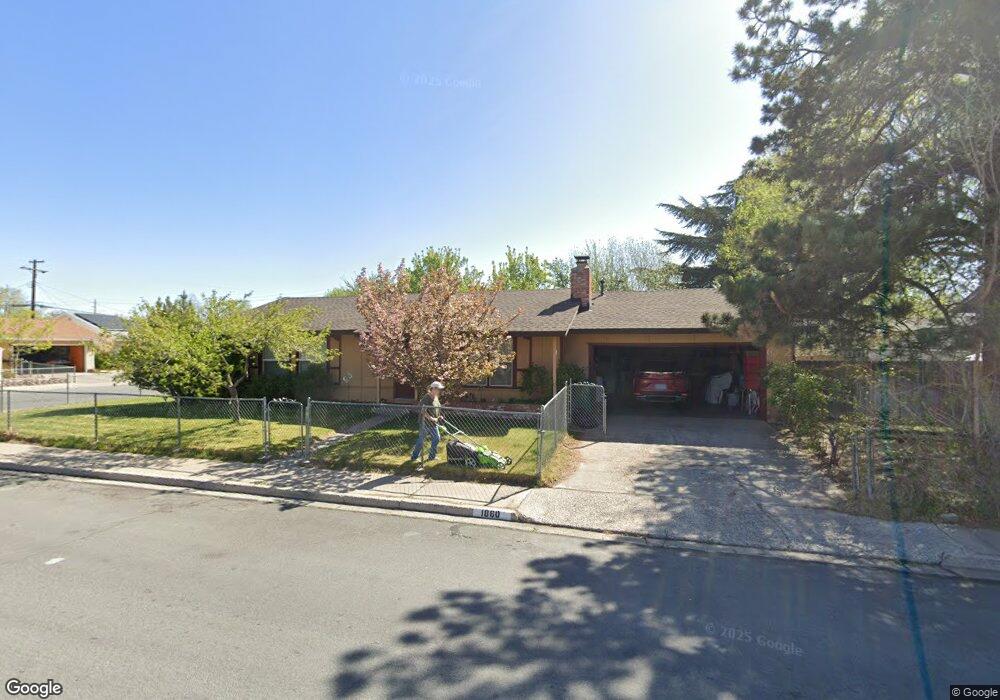
1860 Oppio St Sparks, NV 89431
North Rock NeighborhoodEstimated Value: $377,244 - $407,000
3
Beds
2
Baths
1,092
Sq Ft
$359/Sq Ft
Est. Value
About This Home
This home is located at 1860 Oppio St, Sparks, NV 89431 and is currently estimated at $391,811, approximately $358 per square foot. 1860 Oppio St is a home located in Washoe County with nearby schools including Agnes Risley Elementary School, Sparks Middle School, and Sparks High School.
Ownership History
Date
Name
Owned For
Owner Type
Purchase Details
Closed on
Oct 28, 2003
Sold by
Gordon Alison A
Bought by
Higginbotham Perry R and Cotton Corina K
Current Estimated Value
Home Financials for this Owner
Home Financials are based on the most recent Mortgage that was taken out on this home.
Original Mortgage
$127,280
Outstanding Balance
$58,761
Interest Rate
5.94%
Mortgage Type
Unknown
Estimated Equity
$333,050
Purchase Details
Closed on
Jun 21, 2000
Sold by
Hanks Alison A and Gordon Alison A
Bought by
Gordon Alison A
Purchase Details
Closed on
Jul 27, 1999
Sold by
Triszczuk Klaus and Triszczuk Anastzia
Bought by
Hanks Alison A
Home Financials for this Owner
Home Financials are based on the most recent Mortgage that was taken out on this home.
Original Mortgage
$92,000
Interest Rate
7.64%
Purchase Details
Closed on
Apr 24, 1996
Sold by
Pecson Uraiwan
Bought by
Triszczuk Klaus and Triszczuk Anastzia
Home Financials for this Owner
Home Financials are based on the most recent Mortgage that was taken out on this home.
Original Mortgage
$81,700
Interest Rate
7%
Create a Home Valuation Report for This Property
The Home Valuation Report is an in-depth analysis detailing your home's value as well as a comparison with similar homes in the area
Home Values in the Area
Average Home Value in this Area
Purchase History
| Date | Buyer | Sale Price | Title Company |
|---|---|---|---|
| Higginbotham Perry R | $435,966 | First Centennial Title Co | |
| Gordon Alison A | -- | -- | |
| Hanks Alison A | $118,000 | First American Title Co | |
| Triszczuk Klaus | $111,500 | Founders Title Co |
Source: Public Records
Mortgage History
| Date | Status | Borrower | Loan Amount |
|---|---|---|---|
| Open | Higginbotham Perry R | $127,280 | |
| Previous Owner | Hanks Alison A | $92,000 | |
| Previous Owner | Triszczuk Klaus | $81,700 |
Source: Public Records
Tax History Compared to Growth
Tax History
| Year | Tax Paid | Tax Assessment Tax Assessment Total Assessment is a certain percentage of the fair market value that is determined by local assessors to be the total taxable value of land and additions on the property. | Land | Improvement |
|---|---|---|---|---|
| 2025 | $794 | $53,337 | $34,825 | $18,512 |
| 2024 | $794 | $48,167 | $30,205 | $17,962 |
| 2023 | $773 | $48,382 | $31,780 | $16,602 |
| 2022 | $751 | $40,668 | $27,160 | $13,508 |
| 2021 | $698 | $31,421 | $18,235 | $13,186 |
| 2020 | $675 | $30,790 | $17,850 | $12,940 |
| 2019 | $655 | $29,908 | $17,605 | $12,303 |
| 2018 | $636 | $24,112 | $12,355 | $11,757 |
| 2017 | $611 | $22,778 | $11,235 | $11,543 |
| 2016 | $595 | $21,327 | $9,765 | $11,562 |
| 2015 | $596 | $19,984 | $8,645 | $11,339 |
| 2014 | $578 | $17,084 | $6,335 | $10,749 |
| 2013 | -- | $15,313 | $4,900 | $10,413 |
Source: Public Records
Map
Nearby Homes
- 1655 Byrd Dr
- 2154 Oppio St
- 1124 Sbragia Way
- 1365 Prospect Ave
- 1780 Greenbrae Dr
- 1121 Greenbrae Dr
- 1595 York Way
- 1799 Vance Way
- 1110 Xman Way
- 1003 Sbragia Way
- 1160 York Way
- 1855 Verano Dr
- 1345 Plymouth Way
- 1560 Steven Ct Unit 2
- 1527 Steven Ct
- 1536 Irene Way
- 1841 Merchant St
- 1705 9th St
- 1125 Dodson Way
- 1889 Merchant St
- 1525 Tyler Way
- 1830 Oppio St
- 1545 Tyler Way
- 1835 Rock Blvd
- 1800 Oppio St
- 1540 Tyler Way
- 1835 Oppio St
- 1505 Tyler Way
- 1530 Tyler Way
- 1805 Rock Blvd Unit 2
- 1565 Tyler Way
- 1565 Tyler Way Unit Tyler Way
- 1805 Oppio St
- 1550 Tyler Way
- 1790 Oppio St
- 1510 Tyler Way
- 1950 Oppio St
- 1570 Tyler Way
- 1795 Oppio St
- 1795 Rock Blvd