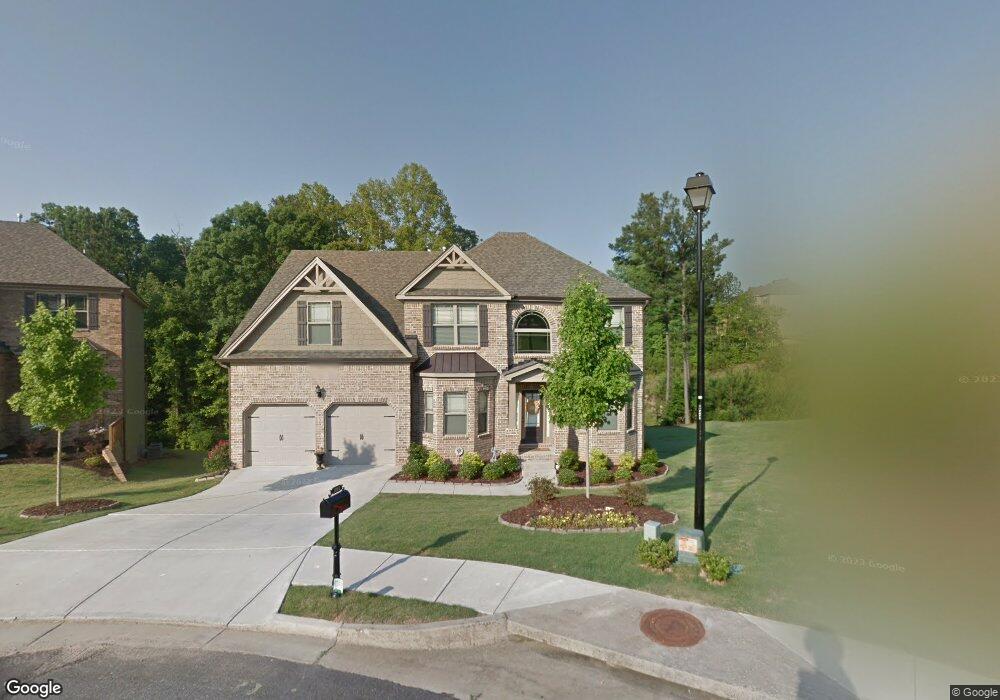
1860 Trinity Mill Dr Unit LOT 62 Dacula, GA 30019
Estimated Value: $559,000 - $579,000
5
Beds
3
Baths
2,950
Sq Ft
$193/Sq Ft
Est. Value
About This Home
This home is located at 1860 Trinity Mill Dr Unit LOT 62, Dacula, GA 30019 and is currently estimated at $568,781, approximately $192 per square foot. 1860 Trinity Mill Dr Unit LOT 62 is a home located in Gwinnett County with nearby schools including Fort Daniel Elementary School, Frank N. Osborne Middle School, and Mill Creek High School.
Ownership History
Date
Name
Owned For
Owner Type
Purchase Details
Closed on
Apr 5, 2021
Sold by
Gibson Chester Thomas
Bought by
Patel Suhagben K and Patel Trushna V
Current Estimated Value
Home Financials for this Owner
Home Financials are based on the most recent Mortgage that was taken out on this home.
Original Mortgage
$328,000
Outstanding Balance
$294,858
Interest Rate
3%
Mortgage Type
New Conventional
Estimated Equity
$273,923
Purchase Details
Closed on
Feb 14, 2020
Sold by
Hagewood Meaghan M
Bought by
Gibson Chester Thomas and Gibson Marsha L
Purchase Details
Closed on
Nov 20, 2012
Sold by
Jefferson Homes Inc
Bought by
Hagewood Christopher W and Hagewood Meaghan M
Home Financials for this Owner
Home Financials are based on the most recent Mortgage that was taken out on this home.
Original Mortgage
$205,546
Interest Rate
3.45%
Mortgage Type
New Conventional
Purchase Details
Closed on
Sep 7, 2012
Sold by
Fairway Fund Xii Llc
Bought by
Jefferson Homes Inc
Create a Home Valuation Report for This Property
The Home Valuation Report is an in-depth analysis detailing your home's value as well as a comparison with similar homes in the area
Home Values in the Area
Average Home Value in this Area
Purchase History
| Date | Buyer | Sale Price | Title Company |
|---|---|---|---|
| Patel Suhagben K | $410,000 | -- | |
| Gibson Chester Thomas | $370,000 | -- | |
| Hagewood Christopher W | $256,932 | -- | |
| Jefferson Homes Inc | $225,000 | -- |
Source: Public Records
Mortgage History
| Date | Status | Borrower | Loan Amount |
|---|---|---|---|
| Open | Patel Suhagben K | $328,000 | |
| Previous Owner | Hagewood Christopher W | $205,546 |
Source: Public Records
Tax History Compared to Growth
Tax History
| Year | Tax Paid | Tax Assessment Tax Assessment Total Assessment is a certain percentage of the fair market value that is determined by local assessors to be the total taxable value of land and additions on the property. | Land | Improvement |
|---|---|---|---|---|
| 2025 | -- | $238,080 | $59,840 | $178,240 |
| 2024 | -- | $210,280 | $52,000 | $158,280 |
| 2023 | $2,080 | $210,280 | $52,000 | $158,280 |
| 2022 | $0 | $164,000 | $33,200 | $130,800 |
| 2021 | $5,318 | $140,000 | $28,400 | $111,600 |
| 2020 | $4,580 | $140,000 | $28,400 | $111,600 |
| 2019 | $4,162 | $124,440 | $28,400 | $96,040 |
| 2018 | $4,156 | $124,440 | $28,400 | $96,040 |
| 2016 | $4,003 | $117,240 | $23,200 | $94,040 |
| 2015 | $4,046 | $117,240 | $23,200 | $94,040 |
| 2014 | $3,976 | $113,120 | $23,200 | $89,920 |
Source: Public Records
Map
Nearby Homes
- 3177 Hog Mountain Rd
- 2070 Trinity Mill Dr
- 2405 Millwater Crossing
- 1973 Hamilton Mill Pkwy
- 1843 Hamilton Mill Pkwy
- 2455 Millwater Crossing
- 1470 Highland Forge Ct
- 3222 Green Farm Trail
- 3304 Brooksong Way Unit 2
- 2955 Windsong Park Ln Unit 1
- 2585 Millwater Crossing
- 1495 Mill Place Dr
- 1751 Mulberry Lake Dr
- 2985 Ashton Pointe Cir
- 1872 Bakers Mill Rd
- 1727 Bakers Mill Rd
- 1860 Trinity Mill Dr
- 1869 Trinity Mill Dr
- 1870 Trinity Mill Dr Unit 13
- 1870 Trinity Mill Dr
- 1870 Trinity Mill Dr Unit LOT 61
- 1879 Trinity Mill Dr
- 1920 Trinity Mill Dr
- 1920 Trinity Mill Dr Unit LOT 60
- 1864 Trinity Mill Dr
- 1930 Trinity Mill Dr
- 1930 Trinity Mill Dr Unit LOT 59
- 1889 Trinity Mill Dr
- 1940 Trinity Mill Dr
- 1940 Trinity Mill Dr Unit LOT 58
- 1950 Trinity Mill Dr
- 1950 Trinity Mill Dr Unit LOT 57
- 3097 Trinity Grove Dr
- 1899 Trinity Mill Dr
- 2203 Trinity Grove Ct
- 2203 Trinity Grove Ct Unit LOT 44