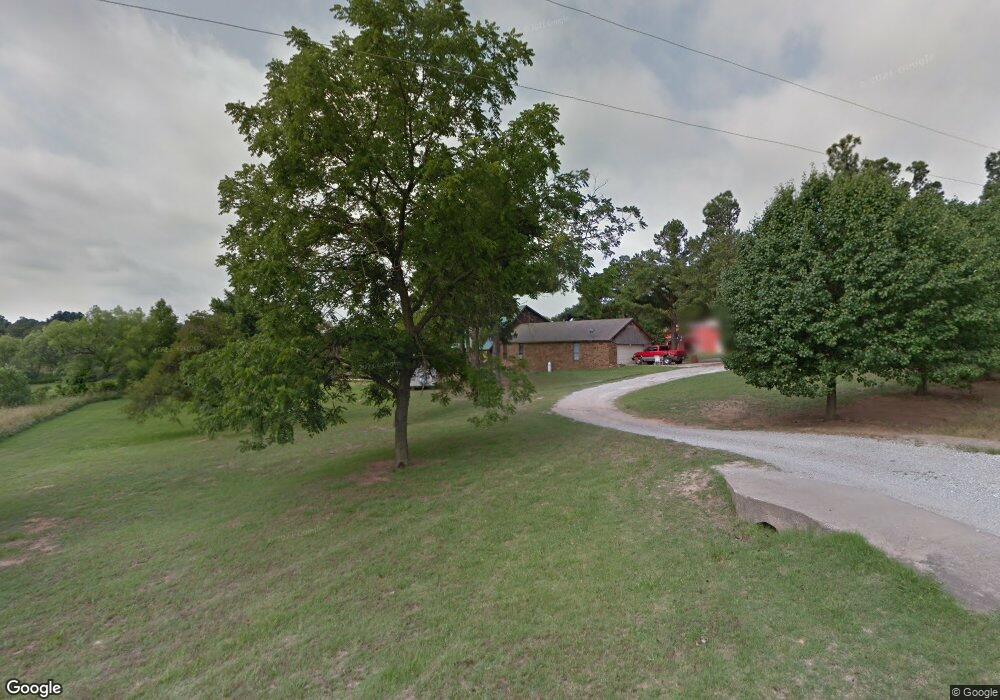
18600 Dawn Rd Newalla, OK 74857
Estimated Value: $312,000 - $644,000
5
Beds
3
Baths
3,822
Sq Ft
$123/Sq Ft
Est. Value
About This Home
This home is located at 18600 Dawn Rd, Newalla, OK 74857 and is currently estimated at $468,752, approximately $122 per square foot. 18600 Dawn Rd is a home located in Oklahoma County with nearby schools including McLoud Elementary School, McLoud Intermediate School, and McLoud Junior High School.
Ownership History
Date
Name
Owned For
Owner Type
Purchase Details
Closed on
Nov 12, 2021
Sold by
Lambert Bobby Wayne and Lambert Paula
Bought by
Lambert Bobby W and Lambert Paula
Current Estimated Value
Home Financials for this Owner
Home Financials are based on the most recent Mortgage that was taken out on this home.
Original Mortgage
$224,900
Outstanding Balance
$206,452
Interest Rate
3.12%
Mortgage Type
New Conventional
Estimated Equity
$262,300
Purchase Details
Closed on
Apr 17, 2013
Sold by
Lamebert Bobby Wayne
Bought by
Lambert Bobby Wyane and Lambert Jesse Wayne
Purchase Details
Closed on
Nov 7, 2006
Sold by
Lambert Alton Wayne and Lambert Martha A
Bought by
Lambert Bobby Wayne
Purchase Details
Closed on
Jan 6, 2003
Sold by
Hudlow Susie and Doe John
Bought by
Federal National Mortgage Association
Purchase Details
Closed on
May 10, 2002
Sold by
Hudlow Susie
Bought by
Hendrix Jeffery D and Hendrix Chastity Nicole
Create a Home Valuation Report for This Property
The Home Valuation Report is an in-depth analysis detailing your home's value as well as a comparison with similar homes in the area
Home Values in the Area
Average Home Value in this Area
Purchase History
| Date | Buyer | Sale Price | Title Company |
|---|---|---|---|
| Lambert Bobby W | -- | American Eagle Title Group | |
| Lambert Bobby Wyane | -- | None Available | |
| Lambert Bobby Wayne | -- | None Available | |
| Federal National Mortgage Association | -- | -- | |
| Hendrix Jeffery D | $15,000 | Capitol Abstract & Title Co |
Source: Public Records
Mortgage History
| Date | Status | Borrower | Loan Amount |
|---|---|---|---|
| Open | Lambert Bobby W | $224,900 |
Source: Public Records
Tax History Compared to Growth
Tax History
| Year | Tax Paid | Tax Assessment Tax Assessment Total Assessment is a certain percentage of the fair market value that is determined by local assessors to be the total taxable value of land and additions on the property. | Land | Improvement |
|---|---|---|---|---|
| 2024 | $3,767 | $37,311 | $2,528 | $34,783 |
| 2023 | $3,767 | $36,225 | $2,704 | $33,521 |
| 2022 | $3,723 | $35,170 | $2,201 | $32,969 |
| 2021 | $4,500 | $34,145 | $2,350 | $31,795 |
| 2020 | $3,508 | $33,151 | $2,263 | $30,888 |
| 2019 | $3,503 | $32,186 | $2,340 | $29,846 |
| 2018 | $1,525 | $12,877 | $0 | $0 |
| 2017 | $1,462 | $12,263 | $2,587 | $9,676 |
| 2016 | $3,079 | $28,343 | $2,587 | $25,756 |
| 2015 | $3,208 | $28,966 | $2,587 | $26,379 |
| 2014 | $3,110 | $28,214 | $3,512 | $24,702 |
Source: Public Records
Map
Nearby Homes
- 18220 SE 95th St
- 9117 S Dobbs Rd
- 8300 Sowell Rd
- 9209 Hazy Brook Dr
- 9000 Sleepy Hollow Dr
- 0 SE Corner Se 59th Peebly St Unit 1194088
- 17201 SE 104th (5 Acres) St
- 17111 SE 104th (10 Ac) St
- 20401 Misty Glen Dr
- 17111 SE 104th St
- 17400 Pantera Ave
- 5900 Permian Dr
- 9025 Hollow Rd
- 9000 Hollow Rd
- 29049 Oilfield Trash Dr
- 12720 S Peebly Rd
- 12724 S Peebly Rd
- 12720 S Peebly Rd Unit Tract4
- 12724 S Peebly Rd Unit Tract1B
- 5701 Sunset Ridge
- 8713 Dusk Rd
- 18600 Twilight Rd
- 18703 Twilight Rd
- 18620 Twilight Rd
- 18729 Twilight Rd
- 8616 Posey Rd
- 18728 Dawn Rd
- 18535 SE 89th St
- 18805 SE 89th St
- 18733 Dawn Rd
- 8530 Posey Rd
- 18813 Twilight Rd
- 18816 Dawn Rd
- 8521 Posey Rd
- 8930 Posey Rd
- 18321 SE 89th St
- 8601 Posey Rd
- 18725 SE 89th St
- 18827 Dawn Rd
- 18700 SE 89th St