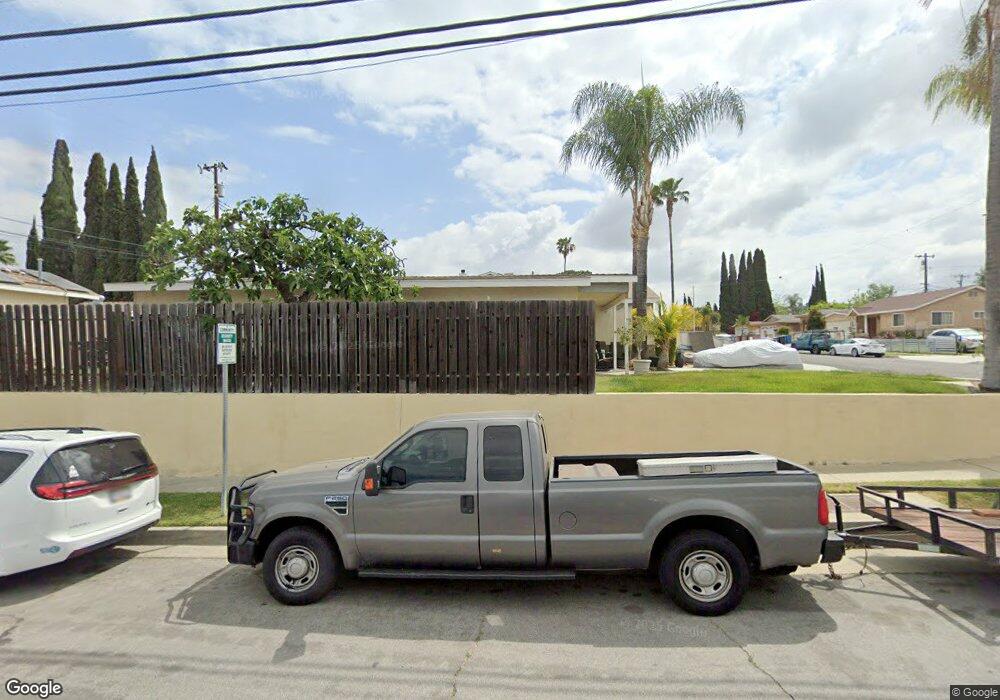
18603 Del Bonita St Rowland Heights, CA 91748
Estimated Value: $672,000 - $820,000
3
Beds
2
Baths
1,040
Sq Ft
$717/Sq Ft
Est. Value
About This Home
This home is located at 18603 Del Bonita St, Rowland Heights, CA 91748 and is currently estimated at $745,620, approximately $716 per square foot. 18603 Del Bonita St is a home located in Los Angeles County with nearby schools including Alvarado Intermediate School, John A. Rowland High School, and Southlands Christian Schools.
Ownership History
Date
Name
Owned For
Owner Type
Purchase Details
Closed on
May 8, 2001
Sold by
Hubbard Frank J and Hubbard Kate C
Bought by
Lyons Jeff
Current Estimated Value
Home Financials for this Owner
Home Financials are based on the most recent Mortgage that was taken out on this home.
Original Mortgage
$163,922
Outstanding Balance
$61,013
Interest Rate
7.15%
Mortgage Type
FHA
Estimated Equity
$684,607
Purchase Details
Closed on
Apr 23, 1999
Sold by
Revocable Living Trust Hubbard Flavius J And and Hubbard Frank J
Bought by
Hubbard Frank J and Hubbard Kate C
Purchase Details
Closed on
May 9, 1996
Sold by
Hubbard Flavius J and Hubbard Vera T
Bought by
Hubbard Flavius J and Hubbard Vera T
Purchase Details
Closed on
Oct 10, 1995
Sold by
Hubbard Flavius J and Hubbard Vera L
Bought by
Hubbard Flavius J and Hubbard Vera L
Create a Home Valuation Report for This Property
The Home Valuation Report is an in-depth analysis detailing your home's value as well as a comparison with similar homes in the area
Home Values in the Area
Average Home Value in this Area
Purchase History
| Date | Buyer | Sale Price | Title Company |
|---|---|---|---|
| Lyons Jeff | $170,000 | North American Title Co | |
| Hubbard Frank J | -- | -- | |
| Hubbard Flavius J | -- | -- | |
| Hubbard Flavius J | -- | -- |
Source: Public Records
Mortgage History
| Date | Status | Borrower | Loan Amount |
|---|---|---|---|
| Open | Lyons Jeff | $163,922 |
Source: Public Records
Tax History Compared to Growth
Tax History
| Year | Tax Paid | Tax Assessment Tax Assessment Total Assessment is a certain percentage of the fair market value that is determined by local assessors to be the total taxable value of land and additions on the property. | Land | Improvement |
|---|---|---|---|---|
| 2025 | $3,448 | $256,136 | $196,330 | $59,806 |
| 2024 | $3,448 | $251,115 | $192,481 | $58,634 |
| 2023 | $3,338 | $246,192 | $188,707 | $57,485 |
| 2022 | $3,261 | $241,365 | $185,007 | $56,358 |
| 2021 | $3,202 | $236,633 | $181,380 | $55,253 |
| 2020 | $3,161 | $234,208 | $179,521 | $54,687 |
| 2019 | $3,106 | $229,616 | $176,001 | $53,615 |
| 2018 | $2,968 | $225,114 | $172,550 | $52,564 |
| 2016 | $2,849 | $216,374 | $165,850 | $50,524 |
| 2015 | $2,803 | $213,125 | $163,359 | $49,766 |
| 2014 | $2,800 | $208,952 | $160,160 | $48,792 |
Source: Public Records
Map
Nearby Homes
- 2521 Doubletree Ln
- 18654 Del Bonita St
- 2634 Blandford Dr
- 2503 Abonado Place
- 18536 Mescal St
- 2306 Doubletree Ln
- 2426 Batson Ave
- 2445 Desire Ave
- 18593 Fieldbrook St
- 2474 Patrician View Ave
- 2353 Almeza Ave
- 18555 Fieldbrook St
- 18918 Kensley Place
- 18239 Villa Clara St
- 18220 Gallineta St
- 2270 Paso Real Ave
- 2010 La Cueva Dr
- 18851 Amberly Place
- 3038 Blakeman Ave
- 2039 Bolanos Ave
- 18602 Marimba St
- 18615 Del Bonita St
- 18608 Marimba St
- 2515 Los Padres Dr
- 2521 Los Padres Dr
- 18614 Marimba St
- 18602 Del Bonita St
- 2509 Los Padres Dr
- 18608 Del Bonita St
- 2527 Los Padres Dr
- 18621 Del Bonita St
- 2503 Los Padres Dr
- 18614 Del Bonita St
- 18620 Marimba St
- 2533 Los Padres Dr
- 18620 Del Bonita St
- 18627 Del Bonita St
- 2479 Los Padres Dr
- 18626 Marimba St
- 18619 Aguiro St