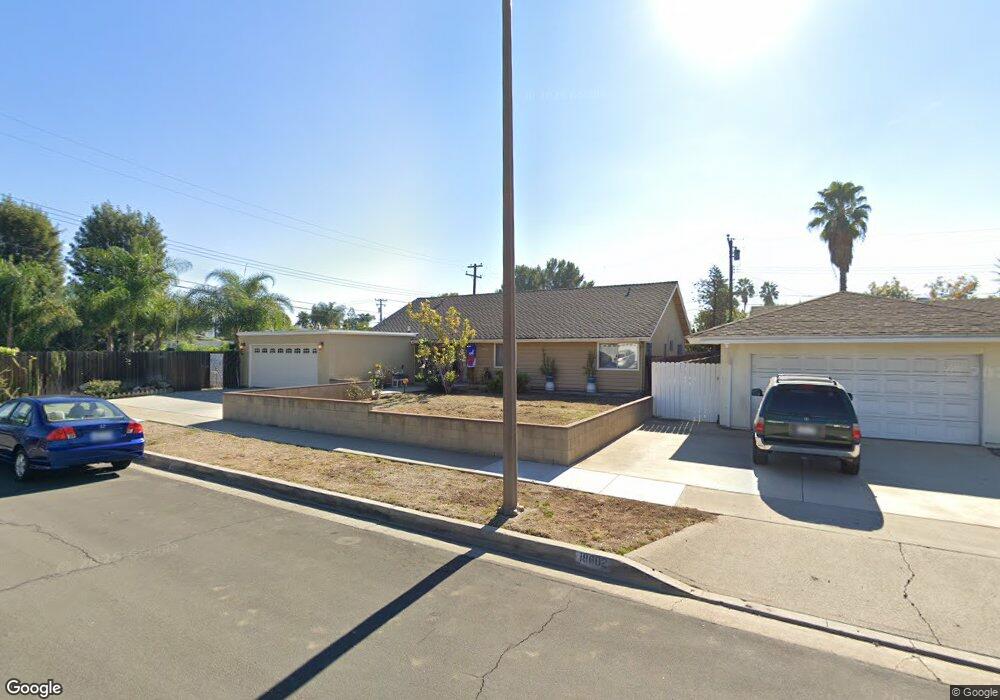
18612 Avolinda Dr Yorba Linda, CA 92886
Estimated Value: $1,110,643 - $1,232,000
4
Beds
2
Baths
1,743
Sq Ft
$675/Sq Ft
Est. Value
About This Home
This home is located at 18612 Avolinda Dr, Yorba Linda, CA 92886 and is currently estimated at $1,176,411, approximately $674 per square foot. 18612 Avolinda Dr is a home located in Orange County with nearby schools including Mabel M. Paine Elementary, Yorba Linda Middle School, and Yorba Linda High School.
Ownership History
Date
Name
Owned For
Owner Type
Purchase Details
Closed on
Oct 7, 2004
Sold by
Quiroz Jose Antonio and Quiroz Demaris Martin
Bought by
Quiroz Jose Antonio and Quiroz Demaris M
Current Estimated Value
Purchase Details
Closed on
Aug 1, 2003
Sold by
Quiroz Jose Antonio and Quiroz Demaris M
Bought by
Quiroz Jose Antonio and Quiroz Demaris Martin
Home Financials for this Owner
Home Financials are based on the most recent Mortgage that was taken out on this home.
Original Mortgage
$190,000
Interest Rate
5.17%
Mortgage Type
Purchase Money Mortgage
Purchase Details
Closed on
Dec 20, 1999
Sold by
Quiroz Jose Antonio and Quiroz Demaris M
Bought by
Quiroz Jose Antonio and Quiroz Demasi M
Purchase Details
Closed on
Jun 20, 1994
Sold by
Shimizu Harold F
Bought by
Quiroz Jose A and Quiroz Demaris M
Home Financials for this Owner
Home Financials are based on the most recent Mortgage that was taken out on this home.
Original Mortgage
$136,000
Interest Rate
8.65%
Create a Home Valuation Report for This Property
The Home Valuation Report is an in-depth analysis detailing your home's value as well as a comparison with similar homes in the area
Home Values in the Area
Average Home Value in this Area
Purchase History
| Date | Buyer | Sale Price | Title Company |
|---|---|---|---|
| Quiroz Jose Antonio | -- | -- | |
| Quiroz Jose Antonio | -- | Fidelity National Title | |
| Quiroz Jose Antonio | -- | -- | |
| Quiroz Jose A | $206,000 | Commonwealth Land Title |
Source: Public Records
Mortgage History
| Date | Status | Borrower | Loan Amount |
|---|---|---|---|
| Closed | Quiroz Jose Antonio | $190,000 | |
| Previous Owner | Quiroz Jose A | $136,000 |
Source: Public Records
Tax History Compared to Growth
Tax History
| Year | Tax Paid | Tax Assessment Tax Assessment Total Assessment is a certain percentage of the fair market value that is determined by local assessors to be the total taxable value of land and additions on the property. | Land | Improvement |
|---|---|---|---|---|
| 2025 | $4,158 | $346,004 | $228,793 | $117,211 |
| 2024 | $4,158 | $339,220 | $224,307 | $114,913 |
| 2023 | $4,073 | $332,569 | $219,909 | $112,660 |
| 2022 | $4,020 | $326,049 | $215,598 | $110,451 |
| 2021 | $3,944 | $319,656 | $211,370 | $108,286 |
| 2020 | $3,837 | $316,379 | $209,203 | $107,176 |
| 2019 | $3,707 | $310,176 | $205,101 | $105,075 |
| 2018 | $3,658 | $304,095 | $201,080 | $103,015 |
| 2017 | $3,598 | $298,133 | $197,137 | $100,996 |
| 2016 | $3,526 | $292,288 | $193,272 | $99,016 |
| 2015 | $3,482 | $287,898 | $190,369 | $97,529 |
| 2014 | $3,380 | $282,259 | $186,640 | $95,619 |
Source: Public Records
Map
Nearby Homes
- 18701 Piper Place
- 18534 Cobblestone Ct
- 4788 Lakeview Ave Unit 48
- 4760 Lakeview Ave
- 4712 Yorba Ln
- 18568 Arbor Gate Ln
- 18640 Seabiscuit Run
- 4317 Canyon Coral Ln
- 18665 Seabiscuit Run
- 4951 Oak Tree Ct
- 4241 Dorthea St
- 4125 Temhurst Ct
- 19072 Lamplight Ln
- 18141 Bastanchury Rd
- 18948 Spectacular Bid Ln
- 4302 Eureka Ave
- 18742 Turfway Park
- 18751 Turfway Park
- 4845 Eisenhower Ct
- 18083 Burke Ln
- 18602 Avolinda Dr
- 18611 Oriente Dr
- 4591 Zella Ln
- 18601 Oriente Dr
- 18631 Oriente Dr
- 18592 Avolinda Dr
- 18611 Avolinda Dr
- 4581 Zella Ln
- 18591 Oriente Dr
- 18601 Avolinda Dr
- 18641 Oriente Dr
- 18645 Oriente Dr
- 18582 Avolinda Dr
- 18647 Oriente Dr
- 18581 Avolinda Dr
- 4571 Zella Ln
- 18581 Oriente Dr
- 4602 Zella Ln
- 18602 Piper Place
- 18653 Oriente Dr