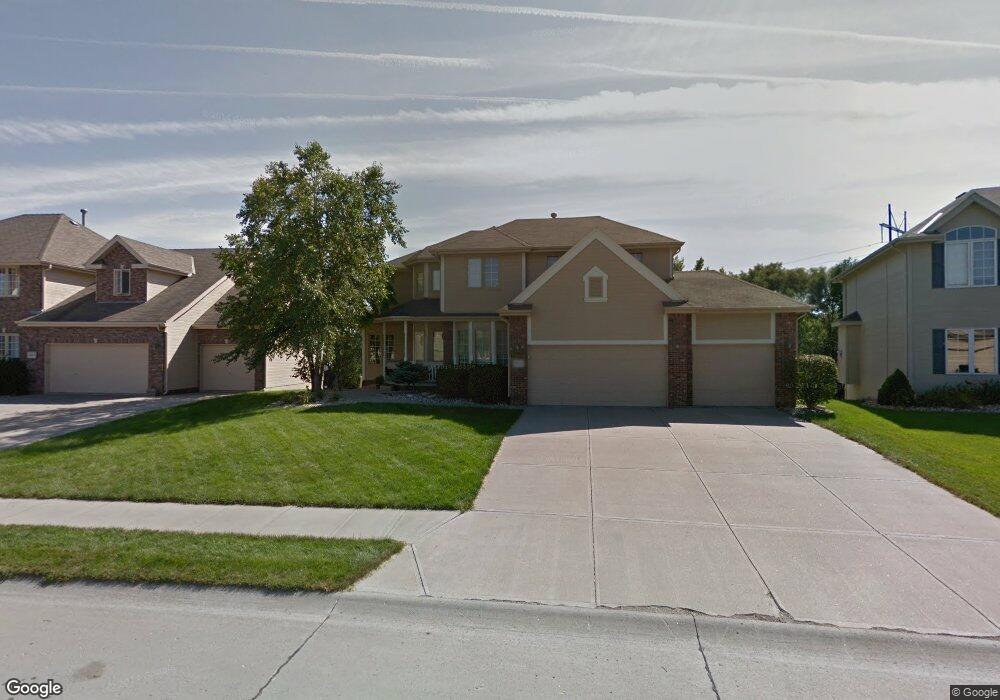
18621 N Gertrude Omaha, NE 68136
Southwest Omaha NeighborhoodEstimated Value: $519,000 - $557,000
4
Beds
6
Baths
2,476
Sq Ft
$215/Sq Ft
Est. Value
About This Home
This home is located at 18621 N Gertrude, Omaha, NE 68136 and is currently estimated at $533,465, approximately $215 per square foot. 18621 N Gertrude is a home located in Sarpy County with nearby schools including Reeder Elementary School, Beadle Middle School, and Millard West High School.
Ownership History
Date
Name
Owned For
Owner Type
Purchase Details
Closed on
Apr 13, 2018
Sold by
Murman Daniel L and Bishop Julia K
Bought by
Connell Matthew T and Connell Angela M
Current Estimated Value
Home Financials for this Owner
Home Financials are based on the most recent Mortgage that was taken out on this home.
Original Mortgage
$268,800
Outstanding Balance
$231,163
Interest Rate
4.44%
Mortgage Type
New Conventional
Estimated Equity
$302,302
Purchase Details
Closed on
Jun 30, 2004
Sold by
Pacesetter Homes Inc
Bought by
Murman Daniel L and Bishop Julia K
Home Financials for this Owner
Home Financials are based on the most recent Mortgage that was taken out on this home.
Original Mortgage
$231,900
Interest Rate
6.32%
Purchase Details
Closed on
Dec 18, 2001
Sold by
Sugar Creek Llc
Bought by
Pacesetter Homes Inc
Create a Home Valuation Report for This Property
The Home Valuation Report is an in-depth analysis detailing your home's value as well as a comparison with similar homes in the area
Home Values in the Area
Average Home Value in this Area
Purchase History
| Date | Buyer | Sale Price | Title Company |
|---|---|---|---|
| Connell Matthew T | $336,000 | Ambassador Title Services | |
| Murman Daniel L | $290,000 | -- | |
| Pacesetter Homes Inc | $35,000 | -- |
Source: Public Records
Mortgage History
| Date | Status | Borrower | Loan Amount |
|---|---|---|---|
| Open | Connell Matthew T | $268,800 | |
| Previous Owner | Murman Daniel L | $231,900 |
Source: Public Records
Tax History Compared to Growth
Tax History
| Year | Tax Paid | Tax Assessment Tax Assessment Total Assessment is a certain percentage of the fair market value that is determined by local assessors to be the total taxable value of land and additions on the property. | Land | Improvement |
|---|---|---|---|---|
| 2025 | $8,601 | $534,732 | $68,000 | $466,732 |
| 2024 | $9,289 | $506,652 | $64,000 | $442,652 |
| 2023 | $9,289 | $456,892 | $62,000 | $394,892 |
| 2022 | $8,684 | $393,394 | $58,000 | $335,394 |
| 2021 | $8,301 | $368,746 | $56,000 | $312,746 |
| 2020 | $8,189 | $358,169 | $51,000 | $307,169 |
| 2019 | $7,950 | $347,010 | $51,000 | $296,010 |
| 2018 | $7,612 | $323,365 | $48,000 | $275,365 |
| 2017 | $7,333 | $308,029 | $48,000 | $260,029 |
| 2016 | $7,223 | $295,507 | $38,000 | $257,507 |
| 2015 | $7,288 | $290,701 | $38,000 | $252,701 |
| 2014 | $7,408 | $288,987 | $38,000 | $250,987 |
| 2012 | -- | $261,274 | $38,000 | $223,274 |
Source: Public Records
Map
Nearby Homes
- 18628 Emiline St
- 18514 Olive Cir
- 7035 S 184th St
- 7401 S 186th St
- 7354 S 185th St
- 18913 Hayes Cir
- 7008 S 183rd Ave
- 18337 Polk St
- 18710 Lillian St
- 7301 S 184th St
- 10219 S 191st St
- 7508 S 185th St
- 18921 Lillian St
- 10416 S 191st St
- 6202 S 189th St
- 18828 Washington St
- 18461 Redwood St
- 18035 Josephine St
- 6812 S 181st Ct
- 7112 S 193rd St
- 18621 Gertrude St
- 18625 Gertrude St
- 18629 Gertrude St
- 18613 Gertrude St
- 18618 Gertrude St
- 18614 Gertrude St
- 18610 Gertrude St
- 18633 Gertrude St
- 18622 Gertrude St
- 18609 Gertrude St
- 20615 Emiline St
- 20607 Emiline St
- 18623 Emiline St
- 18626 Gertrude St
- 18637 Gertrude St
- 18605 Gertrude St
- 18615 Emiline St
- 166 Sugar Creek Trail
- 313 Sugar Creek Trail
- 105 Sugar Creek Trail