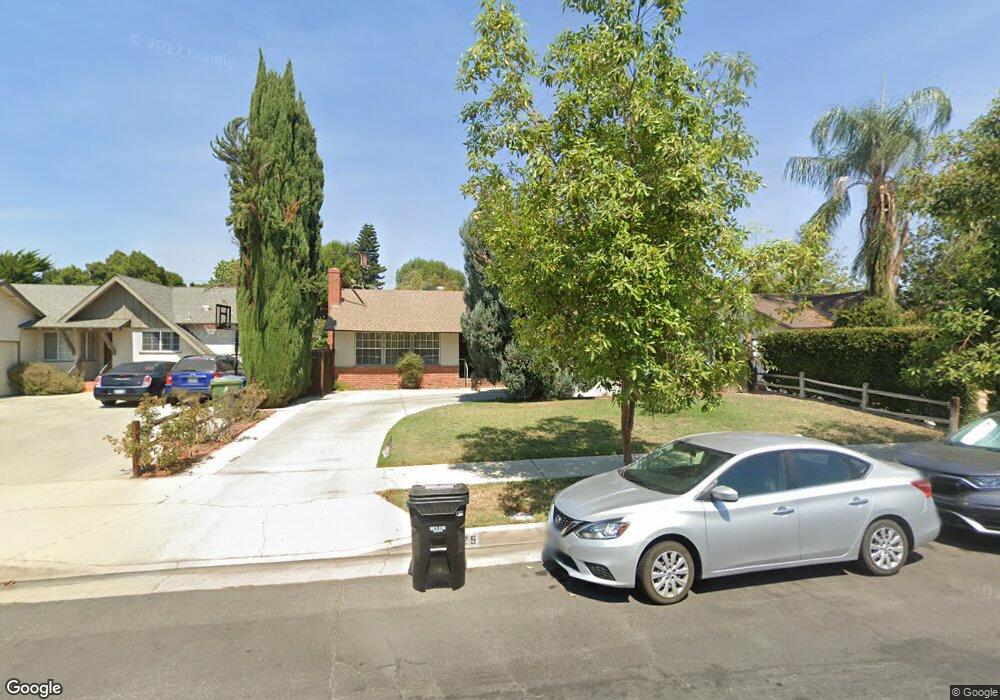
18625 Vincennes St Northridge, CA 91324
Estimated Value: $857,000 - $965,000
3
Beds
2
Baths
1,470
Sq Ft
$614/Sq Ft
Est. Value
About This Home
This home is located at 18625 Vincennes St, Northridge, CA 91324 and is currently estimated at $902,302, approximately $613 per square foot. 18625 Vincennes St is a home located in Los Angeles County with nearby schools including Northridge Academy High, Valley Academy of Arts & Sciences, and Topeka Charter School For Advanced Studies.
Ownership History
Date
Name
Owned For
Owner Type
Purchase Details
Closed on
Nov 21, 2018
Sold by
Urie V James S
Bought by
Urie V James Samuel and James Samuel Urie Iv Trust
Current Estimated Value
Home Financials for this Owner
Home Financials are based on the most recent Mortgage that was taken out on this home.
Original Mortgage
$145,000
Outstanding Balance
$127,498
Interest Rate
4.8%
Mortgage Type
New Conventional
Estimated Equity
$774,804
Purchase Details
Closed on
Nov 6, 2018
Sold by
Urie V James S and James S Urie Iv Trust
Bought by
Urie V James S and The James S Urie V Revocable T
Home Financials for this Owner
Home Financials are based on the most recent Mortgage that was taken out on this home.
Original Mortgage
$145,000
Outstanding Balance
$127,498
Interest Rate
4.8%
Mortgage Type
New Conventional
Estimated Equity
$774,804
Purchase Details
Closed on
Sep 21, 2001
Sold by
Urie James Samuel and The James Samuel Urie Iv Trust
Bought by
Urie James Samuel and The James Samuel Urie Iv Trust
Create a Home Valuation Report for This Property
The Home Valuation Report is an in-depth analysis detailing your home's value as well as a comparison with similar homes in the area
Home Values in the Area
Average Home Value in this Area
Purchase History
| Date | Buyer | Sale Price | Title Company |
|---|---|---|---|
| Urie V James Samuel | -- | North American Title Company | |
| Urie V James S | -- | North American Title Company | |
| Urie V James S | -- | None Available | |
| Urie James Samuel | -- | -- |
Source: Public Records
Mortgage History
| Date | Status | Borrower | Loan Amount |
|---|---|---|---|
| Open | Urie V James S | $145,000 |
Source: Public Records
Tax History Compared to Growth
Tax History
| Year | Tax Paid | Tax Assessment Tax Assessment Total Assessment is a certain percentage of the fair market value that is determined by local assessors to be the total taxable value of land and additions on the property. | Land | Improvement |
|---|---|---|---|---|
| 2025 | $1,699 | $117,855 | $32,081 | $85,774 |
| 2024 | $1,699 | $115,545 | $31,452 | $84,093 |
| 2023 | $1,672 | $113,281 | $30,836 | $82,445 |
| 2022 | $1,604 | $111,061 | $30,232 | $80,829 |
| 2021 | $1,577 | $108,885 | $29,640 | $79,245 |
| 2019 | $1,535 | $105,658 | $28,762 | $76,896 |
| 2018 | $1,408 | $103,588 | $28,199 | $75,389 |
| 2016 | $1,331 | $99,567 | $27,105 | $72,462 |
| 2015 | $1,313 | $98,072 | $26,698 | $71,374 |
| 2014 | $1,326 | $96,152 | $26,176 | $69,976 |
Source: Public Records
Map
Nearby Homes
- 18645 Knapp St
- 9506 Yolanda Ave
- 18540 Prairie St
- 18839 Plummer St
- 9301 Darby Ave
- 9625 Yolanda Ave
- 18729 Sunburst St
- 9251 Wystone Ave
- 9763 Reseda Blvd Unit 83
- 8939 Rhea Ave
- 19029 Nordhoff St Unit 103
- 19029 Nordhoff St Unit 308
- 19029 Nordhoff St Unit 108
- 8921 Geyser Ave
- 19128 Prairie St
- 8961 Etiwanda Ave
- 9000 Vanalden Ave Unit 197
- 18900 Ledan St
- 9854 Canby Ave
- 19200 Ballinger St
- 18631 Vincennes St
- 18619 Vincennes St
- 18611 Vincennes St
- 18637 Vincennes St
- 18624 Gledhill St
- 18628 Gledhill St
- 18618 Gledhill St
- 18607 Vincennes St
- 18643 Vincennes St
- 18612 Gledhill St
- 18636 Gledhill St
- 18626 Vincennes St
- 18620 Vincennes St
- 18632 Vincennes St
- 18614 Vincennes St
- 18642 Gledhill St
- 18606 Gledhill St
- 18649 Vincennes St
- 18601 Vincennes St
- 18608 Vincennes St