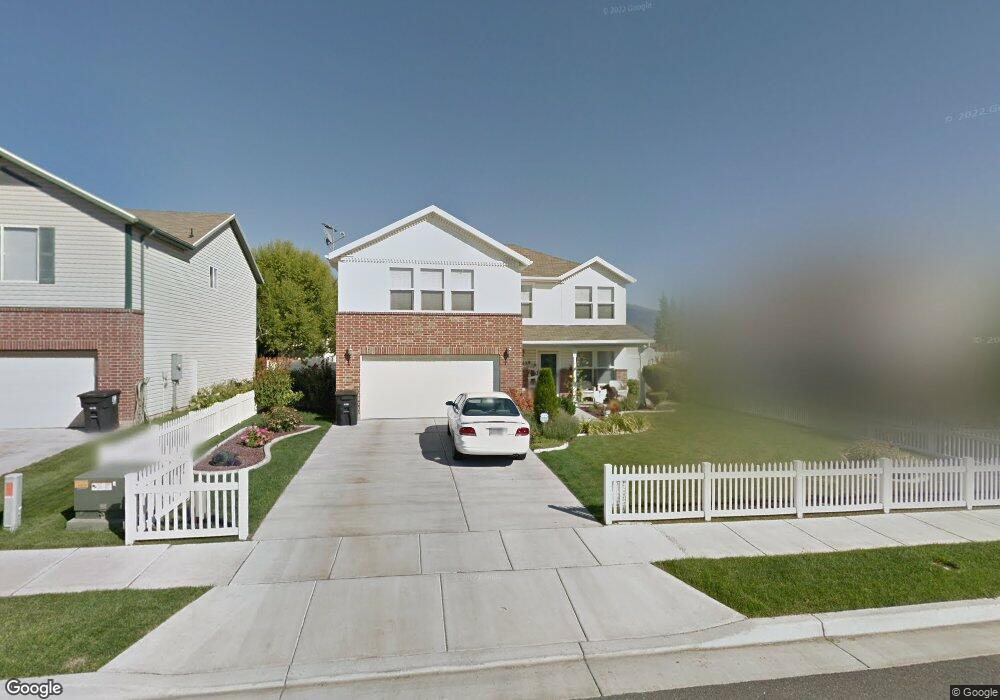
1863 S 725 E Clearfield, UT 84015
Estimated Value: $487,132 - $540,000
4
Beds
3
Baths
2,461
Sq Ft
$208/Sq Ft
Est. Value
About This Home
This home is located at 1863 S 725 E, Clearfield, UT 84015 and is currently estimated at $512,033, approximately $208 per square foot. 1863 S 725 E is a home located in Davis County with nearby schools including Antelope Elementary School, North Davis Junior High School, and Clearfield High School.
Ownership History
Date
Name
Owned For
Owner Type
Purchase Details
Closed on
Nov 26, 2018
Sold by
Bowden Curtis W and Bowden Kathy A
Bought by
Ah4r Properties Two Llc
Current Estimated Value
Purchase Details
Closed on
May 25, 2005
Sold by
Scott Donald A and Scott Donna E
Bought by
Bowden Curtis W and Bowden Kathy A
Home Financials for this Owner
Home Financials are based on the most recent Mortgage that was taken out on this home.
Original Mortgage
$130,896
Interest Rate
5.84%
Mortgage Type
New Conventional
Purchase Details
Closed on
Nov 8, 2001
Sold by
Fieldstone Partners Llc
Bought by
Scott Donald A and Scott Donna E
Home Financials for this Owner
Home Financials are based on the most recent Mortgage that was taken out on this home.
Original Mortgage
$148,463
Interest Rate
6.62%
Mortgage Type
FHA
Create a Home Valuation Report for This Property
The Home Valuation Report is an in-depth analysis detailing your home's value as well as a comparison with similar homes in the area
Home Values in the Area
Average Home Value in this Area
Purchase History
| Date | Buyer | Sale Price | Title Company |
|---|---|---|---|
| Ah4r Properties Two Llc | -- | Hickman Land Title | |
| Bowden Curtis W | -- | First American Title | |
| Scott Donald A | -- | Bonneville Title Company Inc |
Source: Public Records
Mortgage History
| Date | Status | Borrower | Loan Amount |
|---|---|---|---|
| Previous Owner | Bowden Curtis W | $130,896 | |
| Previous Owner | Scott Donald A | $148,463 |
Source: Public Records
Tax History
| Year | Tax Paid | Tax Assessment Tax Assessment Total Assessment is a certain percentage of the fair market value that is determined by local assessors to be the total taxable value of land and additions on the property. | Land | Improvement |
|---|---|---|---|---|
| 2025 | $2,823 | $253,000 | $68,783 | $184,217 |
| 2024 | $2,736 | $246,949 | $65,784 | $181,165 |
| 2023 | $2,517 | $229,350 | $58,090 | $171,259 |
| 2022 | $2,737 | $446,000 | $110,596 | $335,404 |
| 2021 | $2,467 | $334,000 | $62,895 | $271,105 |
| 2020 | $2,142 | $288,000 | $52,571 | $235,429 |
| 2019 | $2,200 | $292,000 | $56,296 | $235,704 |
| 2018 | $2,026 | $262,000 | $49,969 | $212,031 |
| 2016 | $1,766 | $119,405 | $19,842 | $99,563 |
| 2015 | $1,704 | $109,835 | $19,842 | $89,993 |
| 2014 | $1,632 | $106,624 | $19,842 | $86,782 |
| 2013 | -- | $96,757 | $23,760 | $72,997 |
Source: Public Records
Map
Nearby Homes
- 1877 S 725 E
- 906 E Sam Cir
- 1969 S 575 E
- 460 E 1700 S Unit 1 & 2
- 1870 N Celia Way
- 1916 N Celia Way
- 1740 N Gregory Dr
- 1876 W 1575 N Unit 237
- 1896 Cliff Place
- 1570 N 1875 W Unit 242
- 1570 N 1875 W
- 1558 N 1875 W
- 1558 N 1875 W Unit 245
- 1847 John St
- 1491 N 1875 W
- 1487 N 1875 W
- 1487 N 1875 W Unit 159
- 1186 N 2425 W
- 1483 N 1875 W
- 1479 N 1875 W
Your Personal Tour Guide
Ask me questions while you tour the home.