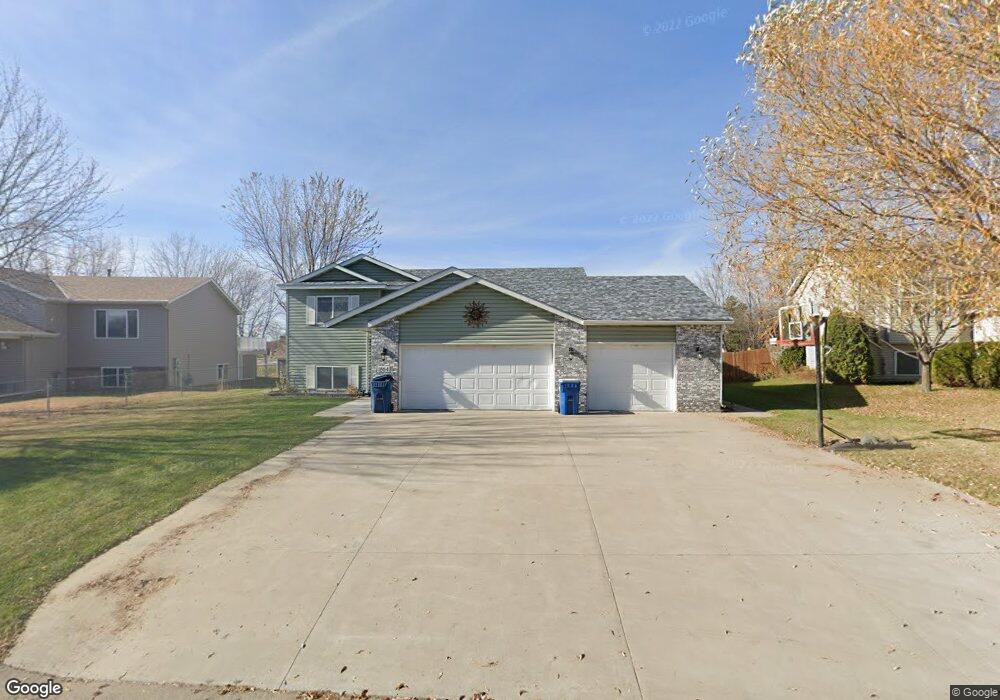
1864 Eastern Star Loop Sauk Rapids, MN 56379
Estimated Value: $309,409 - $330,000
3
Beds
2
Baths
1,270
Sq Ft
$251/Sq Ft
Est. Value
About This Home
This home is located at 1864 Eastern Star Loop, Sauk Rapids, MN 56379 and is currently estimated at $318,852, approximately $251 per square foot. 1864 Eastern Star Loop is a home located in Benton County with nearby schools including Pleasant View Elementary School, Sauk Rapids-Rice Middle School, and Sauk Rapids-Rice Senior High School.
Ownership History
Date
Name
Owned For
Owner Type
Purchase Details
Closed on
Feb 9, 2009
Sold by
Lasalle Bank National Assn
Bought by
Peacock Sean R
Current Estimated Value
Home Financials for this Owner
Home Financials are based on the most recent Mortgage that was taken out on this home.
Original Mortgage
$144,337
Interest Rate
5.37%
Mortgage Type
FHA
Purchase Details
Closed on
Oct 25, 2006
Sold by
Botello Jose Jesus and Rincon Jose
Bought by
Lezama Ana and Farias Dagoberto R
Home Financials for this Owner
Home Financials are based on the most recent Mortgage that was taken out on this home.
Original Mortgage
$172,000
Interest Rate
8.3%
Mortgage Type
Adjustable Rate Mortgage/ARM
Purchase Details
Closed on
Apr 25, 2005
Sold by
Neuman William J and Neuman Dawn M
Bought by
Rincon Jose
Home Financials for this Owner
Home Financials are based on the most recent Mortgage that was taken out on this home.
Original Mortgage
$183,250
Interest Rate
6.06%
Mortgage Type
New Conventional
Create a Home Valuation Report for This Property
The Home Valuation Report is an in-depth analysis detailing your home's value as well as a comparison with similar homes in the area
Home Values in the Area
Average Home Value in this Area
Purchase History
| Date | Buyer | Sale Price | Title Company |
|---|---|---|---|
| Peacock Sean R | $147,000 | -- | |
| Lezama Ana | $215,000 | -- | |
| Rincon Jose | $192,900 | First American Title |
Source: Public Records
Mortgage History
| Date | Status | Borrower | Loan Amount |
|---|---|---|---|
| Previous Owner | Peacock Sean R | $144,337 | |
| Previous Owner | Lezama Ana | $172,000 | |
| Previous Owner | Rincon Jose | $183,250 |
Source: Public Records
Tax History
| Year | Tax Paid | Tax Assessment Tax Assessment Total Assessment is a certain percentage of the fair market value that is determined by local assessors to be the total taxable value of land and additions on the property. | Land | Improvement |
|---|---|---|---|---|
| 2025 | $3,786 | $333,200 | $32,400 | $300,800 |
| 2024 | $3,700 | $309,700 | $32,400 | $277,300 |
| 2023 | $3,526 | $311,400 | $32,400 | $279,000 |
| 2022 | $3,288 | $273,600 | $29,400 | $244,200 |
| 2021 | $2,996 | $235,300 | $29,400 | $205,900 |
| 2018 | $2,574 | $170,900 | $25,322 | $145,578 |
| 2017 | $2,574 | $156,700 | $24,928 | $131,772 |
| 2016 | $2,484 | $173,600 | $28,300 | $145,300 |
| 2015 | $2,516 | $138,800 | $24,322 | $114,478 |
| 2014 | -- | $131,900 | $24,051 | $107,849 |
| 2013 | -- | $132,000 | $24,054 | $107,946 |
Source: Public Records
Map
Nearby Homes
- 405 16th St N
- 1401 4 1/2 Ave N
- 707 Erickson Ct
- 365 13th St N
- 18th 18th
- 1804 Oak Pond Dr
- 828 Wollak Way
- 1209 Oak Pond Dr
- 1806 Oak Pond Dr
- 1227 8th Ave N
- 720 12th St N
- 870 18th St NW
- 820 18th St NW
- 113 14th Ave N
- 390 18th Street Ct NW
- 111 14th Ave N
- 121 14th Ave N
- 115 14th Ave N
- 117 14th Ave N
- 932 Oak Pond Ct
- 1868 Eastern Star Loop
- 1860 Eastern Star Loop
- 1861 Eastern Star Loop
- 1856 Eastern Star Loop
- 1867 Eastern Star Loop
- 1853 Eastern Star Loop
- 1852 Eastern Star Loop
- 427 Daniels Ct
- 423 Daniels Ct
- 1711 4 1/2 Ave N
- 1711 4 1 2 Ave N
- 1849 Eastern Star Loop
- 1848 Eastern Star Loop
- 532 Twin Ct
- 1709 4 1/2 Ave N
- 1709 4 1 2 Ave N
- 431 Daniels Ct
- 394 18th St N
- 1845 Eastern Star Loop
- 531 Twin Ct
Your Personal Tour Guide
Ask me questions while you tour the home.