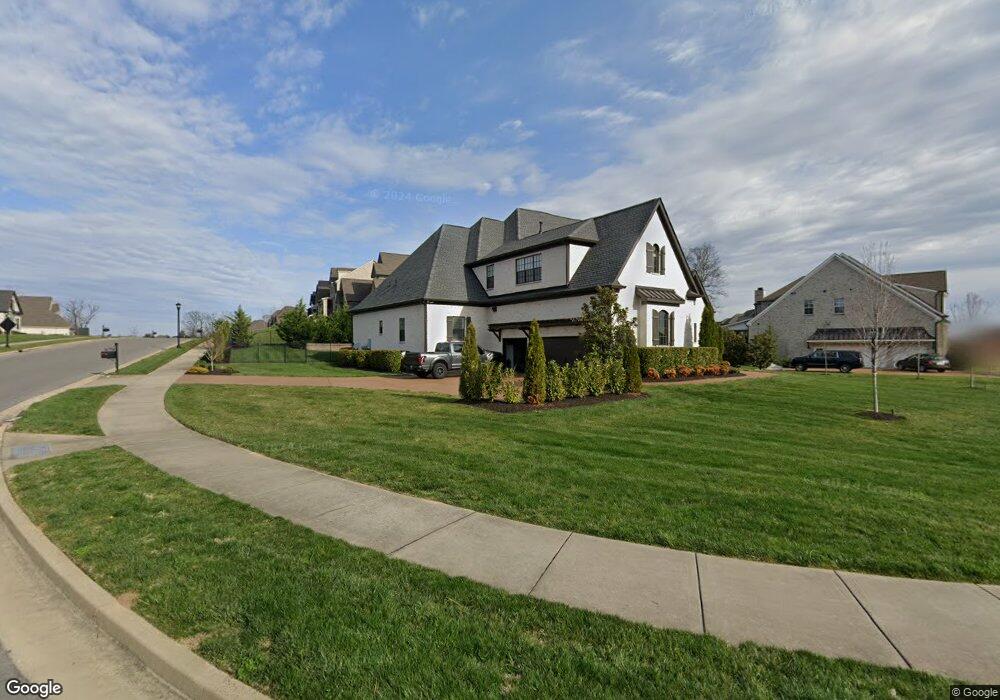
1865 Barnstaple Ln Brentwood, TN 37027
Estimated Value: $1,831,000 - $1,895,000
--
Bed
5
Baths
4,530
Sq Ft
$411/Sq Ft
Est. Value
About This Home
This home is located at 1865 Barnstaple Ln, Brentwood, TN 37027 and is currently estimated at $1,861,804, approximately $410 per square foot. 1865 Barnstaple Ln is a home located in Williamson County with nearby schools including Jordan Elementary School, Sunset Middle School, and Ravenwood High School.
Ownership History
Date
Name
Owned For
Owner Type
Purchase Details
Closed on
Feb 18, 2020
Sold by
The Kandada Trust
Bought by
Davis Christie Ann and Davis Matthew C
Current Estimated Value
Home Financials for this Owner
Home Financials are based on the most recent Mortgage that was taken out on this home.
Original Mortgage
$792,000
Outstanding Balance
$700,034
Interest Rate
3.62%
Mortgage Type
New Conventional
Estimated Equity
$1,161,770
Purchase Details
Closed on
Nov 27, 2017
Sold by
Reddy Venkat and Reddy Nirmala
Bought by
Reddy Venkat K and Reddy Nirmala K
Purchase Details
Closed on
Jun 29, 2016
Sold by
Turnberry Homes Llc
Bought by
Reddy Venkat and Reddy Nirmala
Home Financials for this Owner
Home Financials are based on the most recent Mortgage that was taken out on this home.
Original Mortgage
$350,000
Interest Rate
2.99%
Mortgage Type
Adjustable Rate Mortgage/ARM
Create a Home Valuation Report for This Property
The Home Valuation Report is an in-depth analysis detailing your home's value as well as a comparison with similar homes in the area
Home Values in the Area
Average Home Value in this Area
Purchase History
| Date | Buyer | Sale Price | Title Company |
|---|---|---|---|
| Davis Christie Ann | $990,000 | Limestone Title & Escrow Llc | |
| Reddy Venkat K | -- | None Available | |
| Reddy Venkat | $912,195 | Attorney Title Co Inc |
Source: Public Records
Mortgage History
| Date | Status | Borrower | Loan Amount |
|---|---|---|---|
| Open | Davis Christie Ann | $792,000 | |
| Previous Owner | Reddy Venkat | $350,000 |
Source: Public Records
Tax History Compared to Growth
Tax History
| Year | Tax Paid | Tax Assessment Tax Assessment Total Assessment is a certain percentage of the fair market value that is determined by local assessors to be the total taxable value of land and additions on the property. | Land | Improvement |
|---|---|---|---|---|
| 2025 | $5,901 | $432,700 | $112,500 | $320,200 |
| 2024 | $5,901 | $271,925 | $52,500 | $219,425 |
| 2023 | $5,610 | $258,525 | $52,500 | $206,025 |
| 2022 | $5,610 | $258,525 | $52,500 | $206,025 |
| 2021 | $5,610 | $258,525 | $52,500 | $206,025 |
| 2020 | $5,481 | $212,450 | $43,000 | $169,450 |
| 2019 | $5,481 | $212,450 | $43,000 | $169,450 |
| 2018 | $5,333 | $212,450 | $43,000 | $169,450 |
| 2017 | $5,290 | $212,450 | $43,000 | $169,450 |
| 2016 | $3,196 | $129,900 | $43,000 | $86,900 |
| 2015 | -- | $0 | $0 | $0 |
Source: Public Records
Map
Nearby Homes
- 1851 Barnstaple Ln
- 9479 Helston Ct
- 1898 Traditions Cir
- 1884 Barnstaple Ln
- 1885 Barnstaple Ln
- 1832 Ivy Crest Dr
- 9488 Stillbrook Trace
- 1830 Kettering Trace
- 1931 Parade Dr
- 1852 Traditions Cir
- 9560 Dresden Square
- 6128 Lookaway Cir
- 9539 Dresden Square
- 1801 Morgan Farms Way
- 6124 Lookaway Cir
- 9535 Whitby Crest Ct
- 9409 Clovercroft Rd
- 1932 New Bristol Ln
- 1930 New Bristol Ln
- 1934 New Bristol Ln
- 1865 Barnstaple Ln Unit 148
- 1865 Barnstaple Ln
- 1861 Barnstaple Ln
- 1876 Charity Drive #245
- 1878 Charity Dr Unit 246
- 1878 Charity Dr
- 1867 Barnstaple Ln
- 1859 Barnstaple Ln
- 1859 Barnstaple Ln
- 1876 Charity Dr
- 1876 Charity Dr Unit 245
- 1877 Charity Dr
- 1877 Charity Dr
- 1877 Charity Dr Unit 234
- 1866 Barnstaple Ln
- 1866 Barnstaple Ln Unit 87
- 1866 Barnstaple Ln
- 123 Charity Dr Unit 234
- 123 Charity Drive Lot 234
- 1866 Barnstaple Ln Unit 87