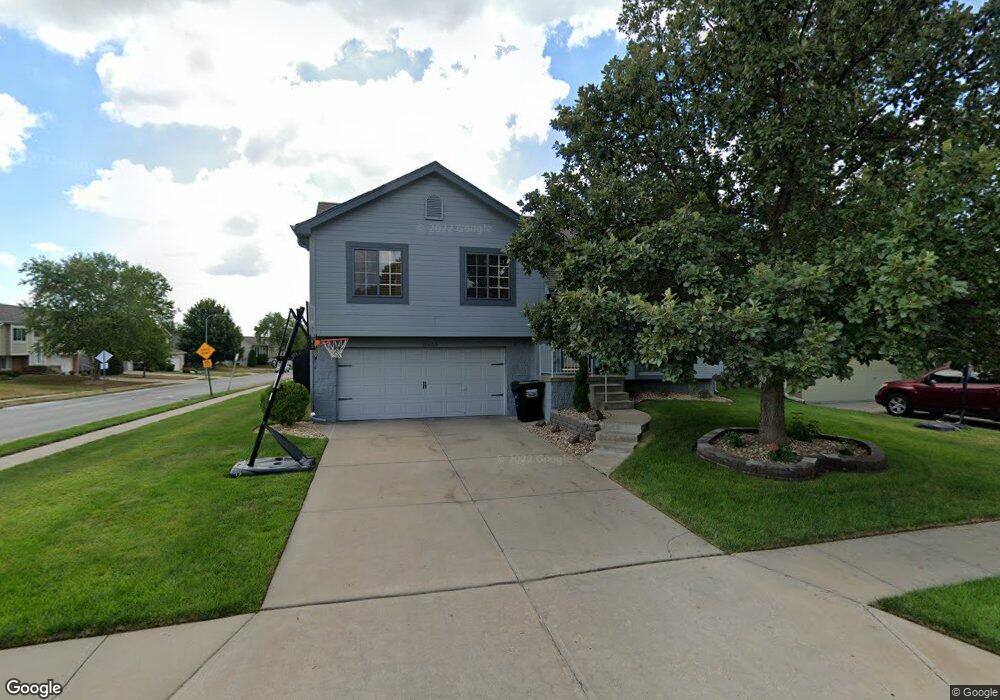
18653 T St Omaha, NE 68135
Southwest Omaha NeighborhoodEstimated Value: $283,000 - $293,008
3
Beds
2
Baths
1,422
Sq Ft
$203/Sq Ft
Est. Value
About This Home
This home is located at 18653 T St, Omaha, NE 68135 and is currently estimated at $288,752, approximately $203 per square foot. 18653 T St is a home located in Douglas County with nearby schools including Reagan Elementary School, Beadle Middle School, and Millard West High School.
Ownership History
Date
Name
Owned For
Owner Type
Purchase Details
Closed on
Nov 17, 2016
Sold by
Jenkins Brandon
Bought by
Jenkins Kandi
Current Estimated Value
Purchase Details
Closed on
May 12, 2009
Sold by
Johnson Randall A and Johnson Joey Beth
Bought by
Jenkins Brandon and Jenkins Kandi
Home Financials for this Owner
Home Financials are based on the most recent Mortgage that was taken out on this home.
Original Mortgage
$131,081
Outstanding Balance
$82,463
Interest Rate
4.77%
Mortgage Type
FHA
Estimated Equity
$206,289
Purchase Details
Closed on
Jul 31, 2003
Sold by
Celebrity Homes Inc
Bought by
Lewis Matthew A and Lewis Georgia M
Create a Home Valuation Report for This Property
The Home Valuation Report is an in-depth analysis detailing your home's value as well as a comparison with similar homes in the area
Home Values in the Area
Average Home Value in this Area
Purchase History
| Date | Buyer | Sale Price | Title Company |
|---|---|---|---|
| Jenkins Kandi | -- | None Available | |
| Jenkins Brandon | $134,000 | None Available | |
| Lewis Matthew A | $136,000 | -- |
Source: Public Records
Mortgage History
| Date | Status | Borrower | Loan Amount |
|---|---|---|---|
| Open | Jenkins Brandon | $131,081 |
Source: Public Records
Tax History Compared to Growth
Tax History
| Year | Tax Paid | Tax Assessment Tax Assessment Total Assessment is a certain percentage of the fair market value that is determined by local assessors to be the total taxable value of land and additions on the property. | Land | Improvement |
|---|---|---|---|---|
| 2024 | $4,923 | $240,500 | $24,100 | $216,400 |
| 2023 | $4,923 | $240,500 | $24,100 | $216,400 |
| 2022 | $4,365 | $195,700 | $24,100 | $171,600 |
| 2021 | $4,384 | $195,700 | $24,100 | $171,600 |
| 2020 | $4,015 | $170,100 | $24,100 | $146,000 |
| 2019 | $4,005 | $170,100 | $24,100 | $146,000 |
| 2018 | $3,912 | $157,100 | $24,100 | $133,000 |
| 2017 | $3,526 | $143,700 | $24,100 | $119,600 |
| 2016 | $3,227 | $130,400 | $14,000 | $116,400 |
| 2015 | $3,322 | $130,400 | $14,000 | $116,400 |
| 2014 | $3,322 | $130,400 | $14,000 | $116,400 |
Source: Public Records
Map
Nearby Homes
- 5525 S 186th Ave
- 5313 S 186th Ave
- 18702 Allan St
- 18711 Borman St
- 5340 S 189th St
- 18704 W St
- 18650 Berry St
- 20132 R St
- 5813 S 191st Ave
- 5146 S 181st Plaza
- 4510 S 202nd St
- 4518 S 202nd St
- 4542 S 202nd St
- 4965 S 190th Ave
- 18923 Holmes St
- 18704 Washington St
- 20125 U St
- 20113 U St
- 20119 U St
- 20113 U St Unit Lot 113