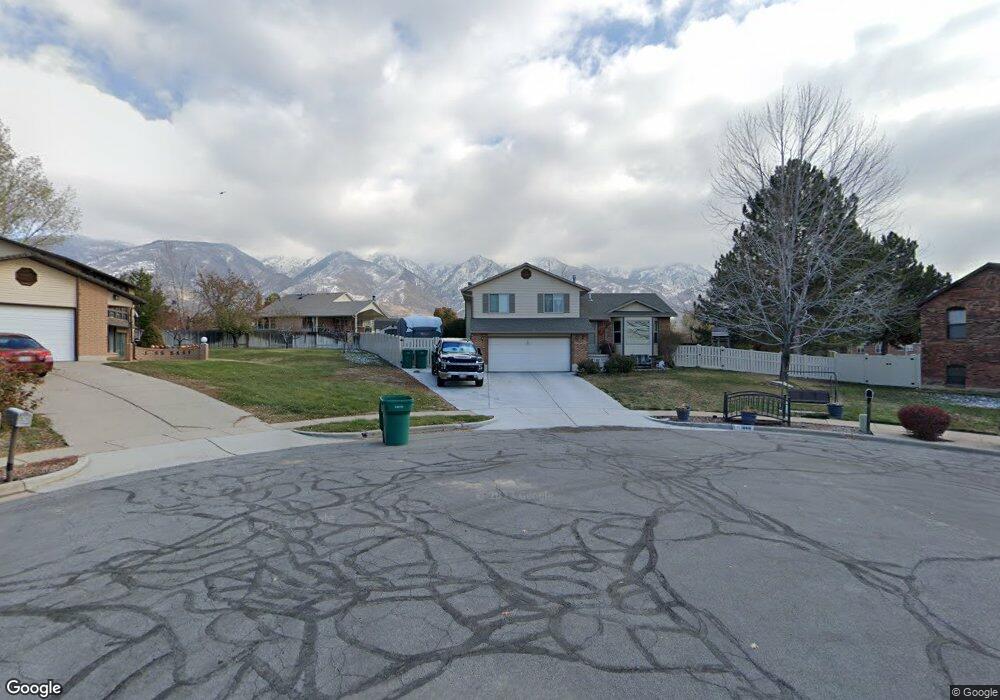
1866 E 2050 N Layton, UT 84040
Estimated Value: $519,000 - $533,711
5
Beds
3
Baths
2,027
Sq Ft
$259/Sq Ft
Est. Value
About This Home
This home is located at 1866 E 2050 N, Layton, UT 84040 and is currently estimated at $525,428, approximately $259 per square foot. 1866 E 2050 N is a home located in Davis County with nearby schools including Sarah Jane Adams Elementary School, North Layton Junior High School, and Northridge High School.
Ownership History
Date
Name
Owned For
Owner Type
Purchase Details
Closed on
Nov 8, 2012
Sold by
Johnson Bruce Wayne and Johnson Rebecca Ann
Bought by
Hessler Harold L and Hessler Victoria D
Current Estimated Value
Home Financials for this Owner
Home Financials are based on the most recent Mortgage that was taken out on this home.
Original Mortgage
$197,870
Outstanding Balance
$135,917
Interest Rate
3.34%
Mortgage Type
VA
Estimated Equity
$389,511
Purchase Details
Closed on
Nov 16, 2001
Sold by
Johnson Bruce Wayne
Bought by
Johnson Bruce Wayne and Johnson Rebecca Ann
Home Financials for this Owner
Home Financials are based on the most recent Mortgage that was taken out on this home.
Original Mortgage
$127,500
Interest Rate
6.06%
Create a Home Valuation Report for This Property
The Home Valuation Report is an in-depth analysis detailing your home's value as well as a comparison with similar homes in the area
Home Values in the Area
Average Home Value in this Area
Purchase History
| Date | Buyer | Sale Price | Title Company |
|---|---|---|---|
| Hessler Harold L | -- | Bonneville Superior Title Co | |
| Johnson Bruce Wayne | -- | Founders Title Co | |
| Johnson Bruce Wayne | -- | Founders Title Co |
Source: Public Records
Mortgage History
| Date | Status | Borrower | Loan Amount |
|---|---|---|---|
| Open | Hessler Harold L | $197,870 | |
| Previous Owner | Johnson Bruce Wayne | $127,500 |
Source: Public Records
Tax History Compared to Growth
Tax History
| Year | Tax Paid | Tax Assessment Tax Assessment Total Assessment is a certain percentage of the fair market value that is determined by local assessors to be the total taxable value of land and additions on the property. | Land | Improvement |
|---|---|---|---|---|
| 2025 | $2,552 | $267,850 | $155,779 | $112,071 |
| 2024 | $2,283 | $241,450 | $173,294 | $68,156 |
| 2023 | $2,248 | $419,000 | $221,539 | $197,461 |
| 2022 | $2,364 | $239,250 | $119,875 | $119,375 |
| 2021 | $2,213 | $334,000 | $184,118 | $149,882 |
| 2020 | $2,003 | $290,000 | $155,936 | $134,064 |
| 2019 | $1,960 | $278,000 | $137,793 | $140,207 |
| 2018 | $1,791 | $255,000 | $112,779 | $142,221 |
| 2016 | $1,644 | $120,780 | $58,191 | $62,589 |
| 2015 | $1,693 | $118,085 | $58,191 | $59,894 |
| 2014 | $1,592 | $113,546 | $58,191 | $55,355 |
| 2013 | -- | $111,716 | $29,850 | $81,866 |
Source: Public Records
Map
Nearby Homes
- 2273 N 1975 E
- 2096 N 1450 E
- 1735 Hayes Dr
- 2011 Dan Dr
- 1251 E Larkspur Way
- 1463 Kays Creek Dr
- 1379 E Petunia Ct
- 1444 E 2400 N
- 1930 N Camellia Way E Unit 407
- 2411 Kays Creek Dr
- 1920 N Camellia Way Unit 406
- 1657 E Cherry Ln
- 1305 E Larkspur Way
- 1313 E Larkspur Way
- 1308 E Larkspur Way
- 2316 E 1975 N
- Richards Plan at Eastridge Park - The Vistas
- Brynlee Plan at Eastridge Park - The Vistas
- Brynlee Plan at Eastridge Park - The Heights
- Ontario Plan at Eastridge Park - The Heights
- 1848 E 2050 N
- 1880 E 2050 N
- 1865 E 2050 N
- 1879 E 2050 N
- 1836 E 2050 N
- 1847 E 2050 N
- 1902 E 2050 N
- 1833 E 2050 N
- 1901 E 2050 N
- 1828 E 2050 N
- 1833 E Beechwood Dr
- 1833 E 1950 N
- 1884 E 2100 N
- 1833 E Beechwood Dr
- 1846 E 2100 N
- 1827 E Beechwood Dr
- 1926 E 2050 N
- 1827 E 2050 N
- 1839 E 1950 N
- 1839 E Beechwood Dr