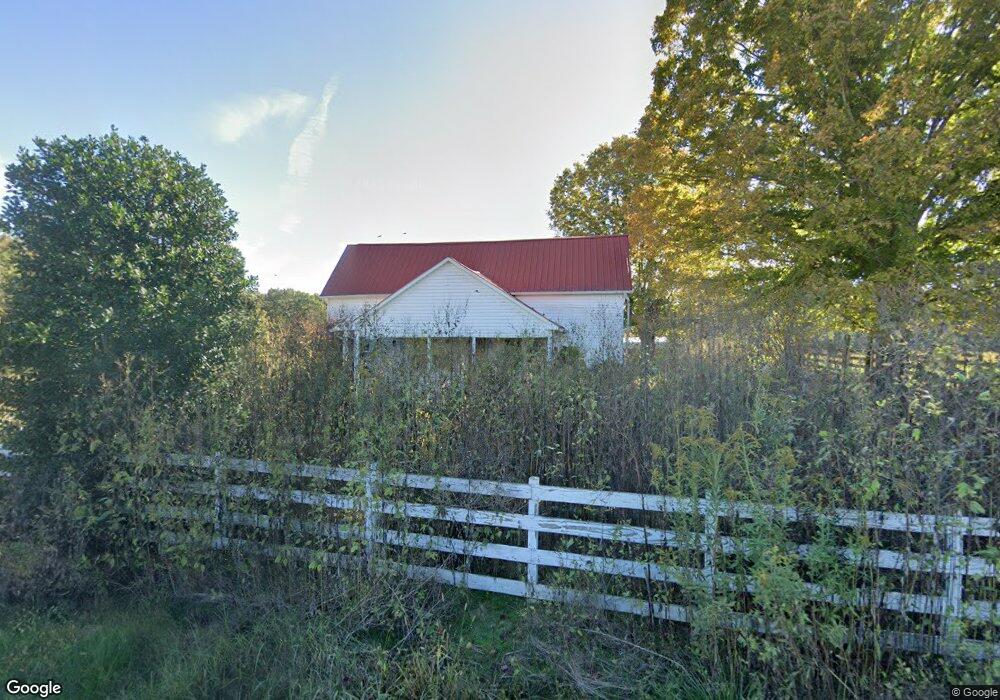
1866 Wildcat Rd Sparta, TN 38583
Estimated Value: $339,000 - $402,291
--
Bed
1
Bath
750
Sq Ft
$494/Sq Ft
Est. Value
About This Home
This home is located at 1866 Wildcat Rd, Sparta, TN 38583 and is currently estimated at $370,646, approximately $494 per square foot. 1866 Wildcat Rd is a home located in White County with nearby schools including Northfield Elementary School, White County Middle School, and White County High School.
Ownership History
Date
Name
Owned For
Owner Type
Purchase Details
Closed on
Jul 28, 2021
Sold by
Brymer Tilbert and Brymer Barbara
Bought by
Daly Jean W and Jean W Daly Trust
Current Estimated Value
Purchase Details
Closed on
May 20, 2021
Sold by
Brymer Marianne C
Bought by
Brymer Tilbert and Brymer Barbara
Purchase Details
Closed on
Nov 22, 2019
Sold by
Brymer Tilbert C and Brymer Barbara J
Bought by
Brymer Tilbert and Brymer Barbara
Purchase Details
Closed on
Nov 28, 2012
Purchase Details
Closed on
Dec 21, 2011
Bought by
Brymer David C
Purchase Details
Closed on
Apr 13, 2004
Sold by
Smith J K
Bought by
Brymer David C
Purchase Details
Closed on
May 6, 1993
Purchase Details
Closed on
Feb 10, 1992
Bought by
Smith Smith J and Smith Peggy L
Purchase Details
Closed on
Apr 4, 1991
Bought by
Smith Smith J and Smith Peggy L
Create a Home Valuation Report for This Property
The Home Valuation Report is an in-depth analysis detailing your home's value as well as a comparison with similar homes in the area
Home Values in the Area
Average Home Value in this Area
Purchase History
| Date | Buyer | Sale Price | Title Company |
|---|---|---|---|
| Daly Jean W | $315,000 | None Available | |
| Brymer Tilbert | -- | None Available | |
| Brymer Tilbert | -- | None Available | |
| -- | -- | -- | |
| Brymer David C | $150,000 | -- | |
| Brymer David C | -- | -- | |
| Brymer David C | $150,000 | -- | |
| Brymer David C | $5,000 | -- | |
| -- | $55,000 | -- | |
| Smith Smith J | $1,000 | -- | |
| Smith Smith J | $8,000 | -- |
Source: Public Records
Tax History Compared to Growth
Tax History
| Year | Tax Paid | Tax Assessment Tax Assessment Total Assessment is a certain percentage of the fair market value that is determined by local assessors to be the total taxable value of land and additions on the property. | Land | Improvement |
|---|---|---|---|---|
| 2025 | $489 | $31,000 | $0 | $0 |
| 2024 | $489 | $23,850 | $22,850 | $1,000 |
| 2023 | $489 | $23,850 | $22,850 | $1,000 |
| 2022 | $489 | $23,850 | $22,850 | $1,000 |
| 2021 | $732 | $23,850 | $22,850 | $1,000 |
| 2020 | $728 | $35,725 | $24,975 | $10,750 |
| 2019 | $560 | $27,325 | $21,250 | $6,075 |
| 2018 | $560 | $27,325 | $21,250 | $6,075 |
| 2017 | $560 | $27,325 | $21,250 | $6,075 |
| 2016 | $560 | $27,325 | $21,250 | $6,075 |
| 2015 | $506 | $27,325 | $21,250 | $6,075 |
| 2014 | -- | $27,325 | $21,250 | $6,075 |
| 2013 | -- | $24,725 | $19,425 | $5,300 |
Source: Public Records
Map
Nearby Homes
- 19.267ac Wildcat Rd
- 377 Margot Dr
- 43 Eli Ln
- 19 Caleb Way
- 5860 Canoe Way
- 5881 Canoe Way
- 3524 Griffintown Rd
- 9510 Medlin Rd
- 9360 Medlin Rd
- 14 Caleb Way
- 15 Caleb Way
- 18 Caleb Way
- 16 Caleb Way
- 1885 Griffintown Rd
- 0 Eli Ln Unit RTC3045610
- 0 Eli Ln Unit RTC2958983
- 0 H O Allison Rd Unit RTC2784203
- 0 H O Allison Rd Unit RTC3033979
- 0 H O Allison Rd Unit RTC2887900
- 41 Eli
- 1738 Wildcat Rd
- 2054 Wildcat Rd
- 2123 Wildcat Rd
- 2082 Wildcat Rd
- 1580 Wildcat Rd
- lot 15 Wildcat Rd
- Lot 16 Wildcat Rd
- lot 14 Wildcat Rd
- lot 20 Wildcat Rd
- lot 17 Wildcat Rd
- 1034 Wildcat Rd
- Lot 6 Wildcat Rd
- lot1 Wildcat Rd
- 00 Wildcat Rd
- 0 Wildcat Rd
- 2243 Wildcat Rd
- 2295 Wildcat Rd
- 1367 Wildcat Rd
- 2324 Wildcat Rd
- 399 Grasshopper Ln