18665 Clear View Ct Minnetonka, MN 55345
Estimated Value: $264,576 - $312,000
3
Beds
3
Baths
1,434
Sq Ft
$195/Sq Ft
Est. Value
About This Home
This home is located at 18665 Clear View Ct, Minnetonka, MN 55345 and is currently estimated at $279,894, approximately $195 per square foot. 18665 Clear View Ct is a home located in Hennepin County with nearby schools including Clear Springs Elementary School, Minnetonka West Middle School, and Minnetonka Senior High School.
Ownership History
Date
Name
Owned For
Owner Type
Purchase Details
Closed on
Sep 20, 2019
Sold by
Melmer Catherine A
Bought by
Lakshminarasimhan Natraj and Srivatsan Sridevi
Current Estimated Value
Home Financials for this Owner
Home Financials are based on the most recent Mortgage that was taken out on this home.
Original Mortgage
$168,000
Outstanding Balance
$128,975
Interest Rate
3.6%
Mortgage Type
New Conventional
Estimated Equity
$150,919
Purchase Details
Closed on
Nov 26, 2012
Sold by
Devos Karen J
Bought by
Melmer Catherine A
Home Financials for this Owner
Home Financials are based on the most recent Mortgage that was taken out on this home.
Original Mortgage
$99,450
Interest Rate
3.37%
Mortgage Type
New Conventional
Purchase Details
Closed on
Jul 27, 2000
Sold by
Hinton Tracy A and Hinton Andrew W
Bought by
Devos Karen J
Purchase Details
Closed on
Apr 30, 1998
Sold by
Harder James E
Bought by
Hinton Tracy A and Hinton Andrew W
Create a Home Valuation Report for This Property
The Home Valuation Report is an in-depth analysis detailing your home's value as well as a comparison with similar homes in the area
Home Values in the Area
Average Home Value in this Area
Purchase History
| Date | Buyer | Sale Price | Title Company |
|---|---|---|---|
| Lakshminarasimhan Natraj | $210,000 | Watermark Title Agency | |
| Melmer Catherine A | $149,485 | Entitle | |
| Devos Karen J | $146,820 | -- | |
| Hinton Tracy A | $110,000 | -- |
Source: Public Records
Mortgage History
| Date | Status | Borrower | Loan Amount |
|---|---|---|---|
| Open | Lakshminarasimhan Natraj | $168,000 | |
| Previous Owner | Melmer Catherine A | $99,450 |
Source: Public Records
Tax History Compared to Growth
Tax History
| Year | Tax Paid | Tax Assessment Tax Assessment Total Assessment is a certain percentage of the fair market value that is determined by local assessors to be the total taxable value of land and additions on the property. | Land | Improvement |
|---|---|---|---|---|
| 2024 | $3,313 | $251,100 | $49,000 | $202,100 |
| 2023 | $3,148 | $251,600 | $49,000 | $202,600 |
| 2022 | $2,942 | $256,700 | $49,000 | $207,700 |
| 2021 | $2,819 | $213,400 | $45,000 | $168,400 |
| 2020 | $2,576 | $205,000 | $45,000 | $160,000 |
| 2019 | $2,233 | $194,000 | $45,000 | $149,000 |
| 2018 | $1,801 | $170,900 | $45,000 | $125,900 |
| 2017 | $1,475 | $120,900 | $40,000 | $80,900 |
| 2016 | $1,648 | $131,600 | $40,000 | $91,600 |
| 2015 | $1,690 | $134,200 | $40,000 | $94,200 |
| 2014 | -- | $123,200 | $40,000 | $83,200 |
Source: Public Records
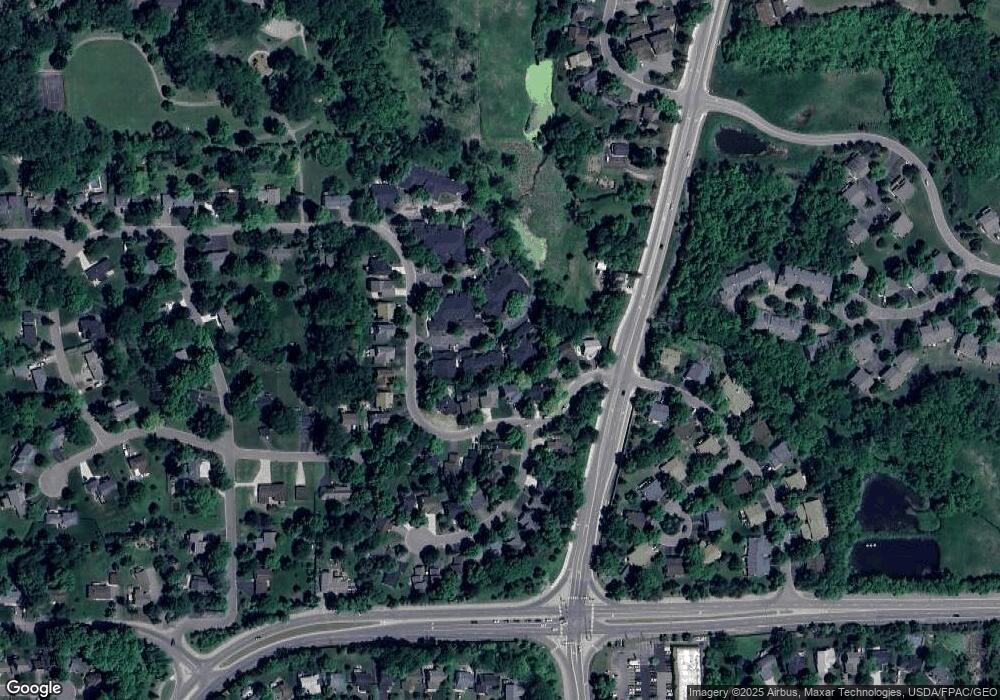
Map
Nearby Homes
- 18502 Apple Tree Ct
- 5826 Salisbury Ave
- 5980 Covington Terrace
- 18130 Covington Path
- 19500 Silver Lake Trail
- 18863 Broadmoore Dr
- 5534 Conifer Trail
- 6015 Ridge Rd
- 450 Indian Hill Rd
- 460 Indian Hill Rd
- 6281 Whispering Oaks Dr
- 19767 Waterford Ct
- 6060 Ridge Rd
- 6285 Duck Lake Rd
- 6620 Horseshoe Curve
- 17110 Claycross Way
- 5800 Scenic Heights Dr
- 5470 Carrie Ln
- 18701 South Ln
- 19139 Maple Leaf Dr
- 18665 Clear View Ct
- 18669 Clear View Ct
- 18677 Clear View Ct
- 18657 Clear View Ct
- 18661 Clear View Ct
- 18645 Clear View Ct
- 18645 Clear View Ct
- 18689 Clear View Ct
- 18689 Clear View Ct
- 18641 Clear View Ct
- 18641 Clear View Ct
- 18724 Clear View Ct
- 18724 Clear View Ct
- 18708 Clear View Ct
- 18708 Clear View Ct
- 18700 Clear View Ct
- 18700 Clear View Ct
- 18626 Clear View Dr
- 18720 Clear View Ct
- 18720 Clear View Ct