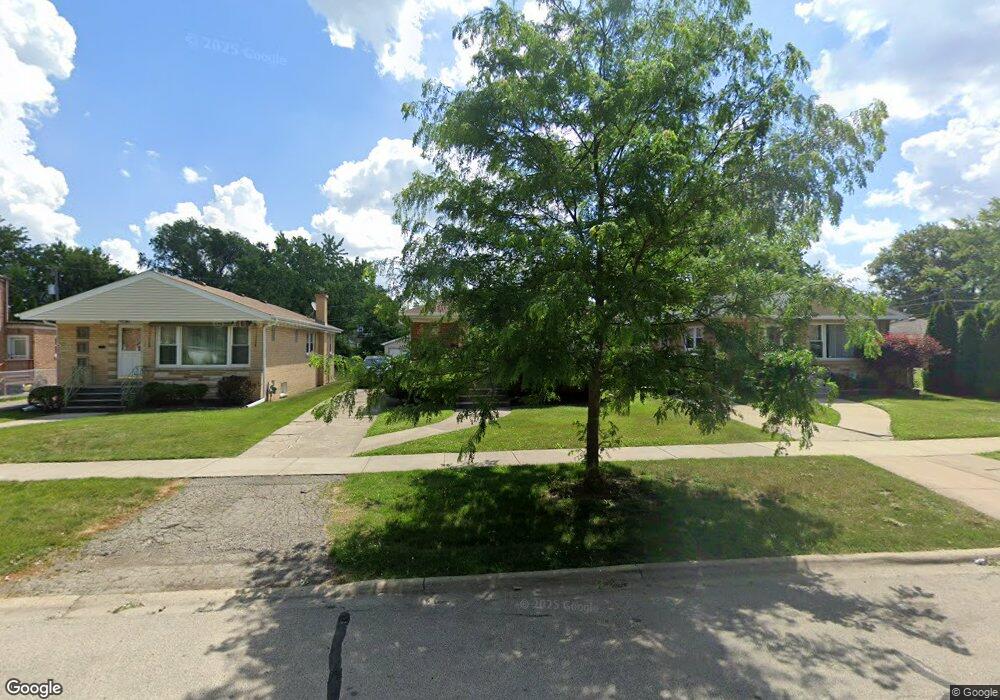
1867 Linden St Des Plaines, IL 60018
Estimated Value: $330,000 - $385,000
3
Beds
1
Bath
1,038
Sq Ft
$336/Sq Ft
Est. Value
About This Home
This home is located at 1867 Linden St, Des Plaines, IL 60018 and is currently estimated at $348,562, approximately $335 per square foot. 1867 Linden St is a home located in Cook County with nearby schools including South Elementary School, Algonquin Middle School, and Maine West High School.
Ownership History
Date
Name
Owned For
Owner Type
Purchase Details
Closed on
Mar 15, 2006
Sold by
Sredzinski Rajmund and Sredzinska Aurelia
Bought by
Worley Richard G and Worley Scott M
Current Estimated Value
Home Financials for this Owner
Home Financials are based on the most recent Mortgage that was taken out on this home.
Original Mortgage
$324,000
Outstanding Balance
$209,421
Interest Rate
9.05%
Mortgage Type
Adjustable Rate Mortgage/ARM
Estimated Equity
$139,142
Purchase Details
Closed on
Aug 26, 1998
Sold by
Motyka Tadeusz and Motyka Teresa
Bought by
Sreczinski Rajmund and Sredzinska Aurelia
Home Financials for this Owner
Home Financials are based on the most recent Mortgage that was taken out on this home.
Original Mortgage
$150,000
Interest Rate
7.06%
Create a Home Valuation Report for This Property
The Home Valuation Report is an in-depth analysis detailing your home's value as well as a comparison with similar homes in the area
Home Values in the Area
Average Home Value in this Area
Purchase History
| Date | Buyer | Sale Price | Title Company |
|---|---|---|---|
| Worley Richard G | $360,000 | Chicago Title Insurance Co | |
| Sreczinski Rajmund | $160,000 | -- |
Source: Public Records
Mortgage History
| Date | Status | Borrower | Loan Amount |
|---|---|---|---|
| Open | Worley Richard G | $324,000 | |
| Previous Owner | Sreczinski Rajmund | $150,000 |
Source: Public Records
Tax History Compared to Growth
Tax History
| Year | Tax Paid | Tax Assessment Tax Assessment Total Assessment is a certain percentage of the fair market value that is determined by local assessors to be the total taxable value of land and additions on the property. | Land | Improvement |
|---|---|---|---|---|
| 2025 | $5,454 | $29,000 | $5,162 | $23,838 |
| 2024 | $5,454 | $24,000 | $4,302 | $19,698 |
| 2023 | $5,295 | $24,000 | $4,302 | $19,698 |
| 2022 | $5,295 | $24,000 | $4,302 | $19,698 |
| 2021 | $4,195 | $16,979 | $3,585 | $13,394 |
| 2020 | $4,193 | $16,979 | $3,585 | $13,394 |
| 2019 | $4,211 | $19,078 | $3,585 | $15,493 |
| 2018 | $4,954 | $20,001 | $3,154 | $16,847 |
| 2017 | $4,884 | $20,001 | $3,154 | $16,847 |
| 2016 | $4,864 | $20,001 | $3,154 | $16,847 |
| 2015 | $4,320 | $16,914 | $2,724 | $14,190 |
| 2014 | $4,245 | $16,914 | $2,724 | $14,190 |
| 2013 | $4,122 | $16,914 | $2,724 | $14,190 |
Source: Public Records
Map
Nearby Homes
- 1721 Prospect Ave
- 1845 Everett Ave
- 1864 Illinois St
- 1445 Everett Ave
- 1689 S Elm St
- 1696 S Elm St
- 1980 Howard Ave
- 1640 S River Rd
- 1754 E Lincoln Ave
- 1673 Spruce Ave
- 1783 Lee St
- 1700 E Forest Ave
- 1641 E Touhy Ave
- 1629 E Touhy Ave
- 1939 E Touhy Ave
- 1625 Estes Ave
- 2500 Maple St
- 1686 Greenleaf Ave
- 1278 E River Dr
- 1489 E Algonquin Rd
- 1873 Linden St
- 1855 Linden St
- 1853 Linden St
- 1680 Prospect Ave
- 1847 Linden St
- 1872 Orchard St
- 1845 Linden St
- 1856 Orchard St
- 1864 Orchard St
- 1884 Orchard St
- 1874 Orchard St
- 1866 Linden St
- 1866 Orchard St
- 1874 Linden St
- 1854 Orchard St
- 1882 Orchard St
- 1858 Linden St
- 1640 Prospect Ave
- 1837 Linden St
- 1848 Orchard St