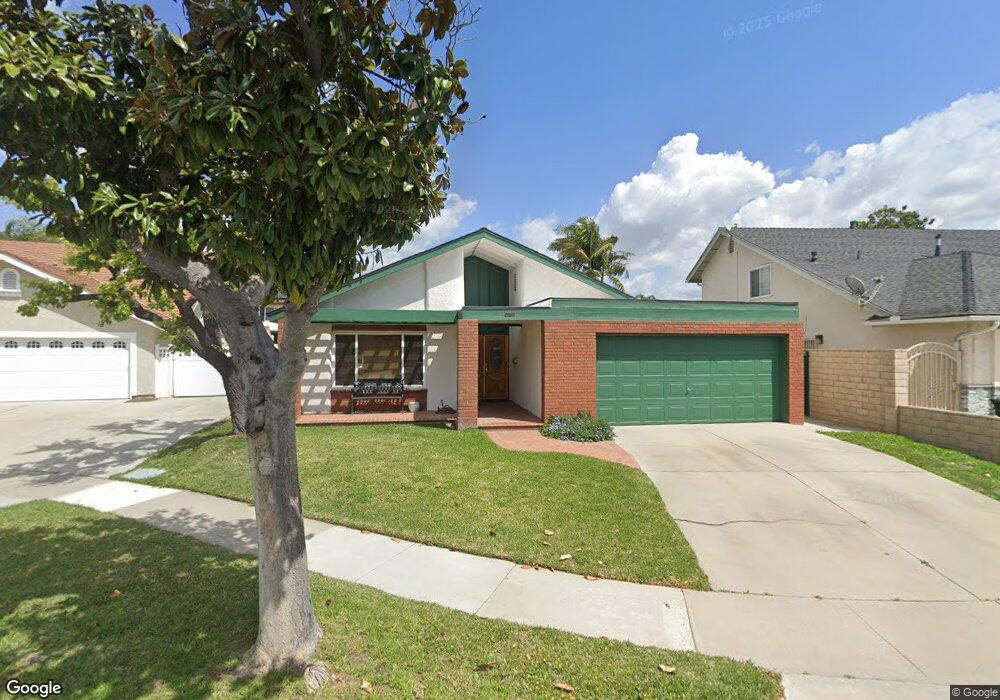
1868 N Glenview Cir Anaheim, CA 92807
Anaheim Hills NeighborhoodEstimated Value: $935,000 - $986,000
3
Beds
2
Baths
1,432
Sq Ft
$665/Sq Ft
Est. Value
About This Home
This home is located at 1868 N Glenview Cir, Anaheim, CA 92807 and is currently estimated at $952,525, approximately $665 per square foot. 1868 N Glenview Cir is a home located in Orange County with nearby schools including Glenview Elementary School, Bernardo Yorba Middle School, and Independence Christian School.
Ownership History
Date
Name
Owned For
Owner Type
Purchase Details
Closed on
Jan 23, 2017
Sold by
Carter Scott D
Bought by
Carter Scott D and Scott D Carter Trust
Current Estimated Value
Purchase Details
Closed on
Apr 25, 2016
Sold by
Carter Tamyra Lynn and Carter Scott D
Bought by
Carter Scott D
Home Financials for this Owner
Home Financials are based on the most recent Mortgage that was taken out on this home.
Original Mortgage
$400,000
Outstanding Balance
$319,152
Interest Rate
3.73%
Mortgage Type
New Conventional
Estimated Equity
$633,373
Purchase Details
Closed on
Oct 13, 2014
Sold by
Carter Scott D
Bought by
Carter Scott D and The Scott D Carter Trust
Purchase Details
Closed on
Nov 23, 1994
Sold by
Holloway John E
Bought by
Carter Scott Deron and Carter Tamyra Lynn
Home Financials for this Owner
Home Financials are based on the most recent Mortgage that was taken out on this home.
Original Mortgage
$180,542
Interest Rate
8.9%
Mortgage Type
Seller Take Back
Create a Home Valuation Report for This Property
The Home Valuation Report is an in-depth analysis detailing your home's value as well as a comparison with similar homes in the area
Home Values in the Area
Average Home Value in this Area
Purchase History
| Date | Buyer | Sale Price | Title Company |
|---|---|---|---|
| Carter Scott D | -- | None Available | |
| Carter Scott D | -- | Lawyers Title | |
| Carter Scott D | -- | None Available | |
| Carter Scott Deron | $1,000 | North American Title Co |
Source: Public Records
Mortgage History
| Date | Status | Borrower | Loan Amount |
|---|---|---|---|
| Open | Carter Scott D | $400,000 | |
| Closed | Carter Scott Deron | $180,542 |
Source: Public Records
Tax History Compared to Growth
Tax History
| Year | Tax Paid | Tax Assessment Tax Assessment Total Assessment is a certain percentage of the fair market value that is determined by local assessors to be the total taxable value of land and additions on the property. | Land | Improvement |
|---|---|---|---|---|
| 2025 | $3,266 | $277,137 | $144,412 | $132,725 |
| 2024 | $3,266 | $271,703 | $141,580 | $130,123 |
| 2023 | $3,209 | $266,376 | $138,804 | $127,572 |
| 2022 | $3,180 | $261,153 | $136,082 | $125,071 |
| 2021 | $3,128 | $256,033 | $133,414 | $122,619 |
| 2020 | $3,134 | $253,408 | $132,046 | $121,362 |
| 2019 | $3,031 | $248,440 | $129,457 | $118,983 |
| 2018 | $2,994 | $243,569 | $126,919 | $116,650 |
| 2017 | $2,870 | $238,794 | $124,431 | $114,363 |
| 2016 | $2,813 | $234,112 | $121,991 | $112,121 |
| 2015 | $2,781 | $230,596 | $120,159 | $110,437 |
| 2014 | $2,699 | $226,079 | $117,805 | $108,274 |
Source: Public Records
Map
Nearby Homes
- 1891 N Garland Ln
- 1817 N Symphony St
- 18501 Woodwind Ln
- 6041 Calle Mirador
- 5018 E Budlong St
- 18511 Orangethorpe Ave
- 1712 N Glenview Ave
- 6052 Candle Light Ln
- 4568 E Meadowhill Ave
- 2024 Tanforan Ave
- 2017 Orchard Dr Unit 11
- 5729 Grandview Ave
- 6032 Sun Knoll Cir
- 17967 Sun Hill Dr
- 1963 Via de la Luna
- 1958 Avenida Del Sol
- 1956 Avenida Del Sol
- 1952 Avenida Del Sol
- 19022 Shamrock Ln
- 5754 Kellogg Dr
- 1866 N Glenview Cir
- 1872 N Glenview Cir
- 1869 N Garland Ln
- 1871 N Garland Ln
- 1865 N Garland Ln
- 1876 N Glenview Cir
- 1875 N Garland Ln
- 1869 N Glenview Cir
- 1871 N Glenview Cir
- 1879 N Glenview Cir
- 1865 N Glenview Cir
- 4904 E Glenview Ave
- 4906 E Glenview Ave
- 1875 N Glenview Cir
- 4900 E Glenview Ave
- 1879 N Garland Ln
- 4908 E Glenview Ave
- 1880 N Garland Ln
- 1856 N Glenview Ave
- 4910 E Glenview Ave