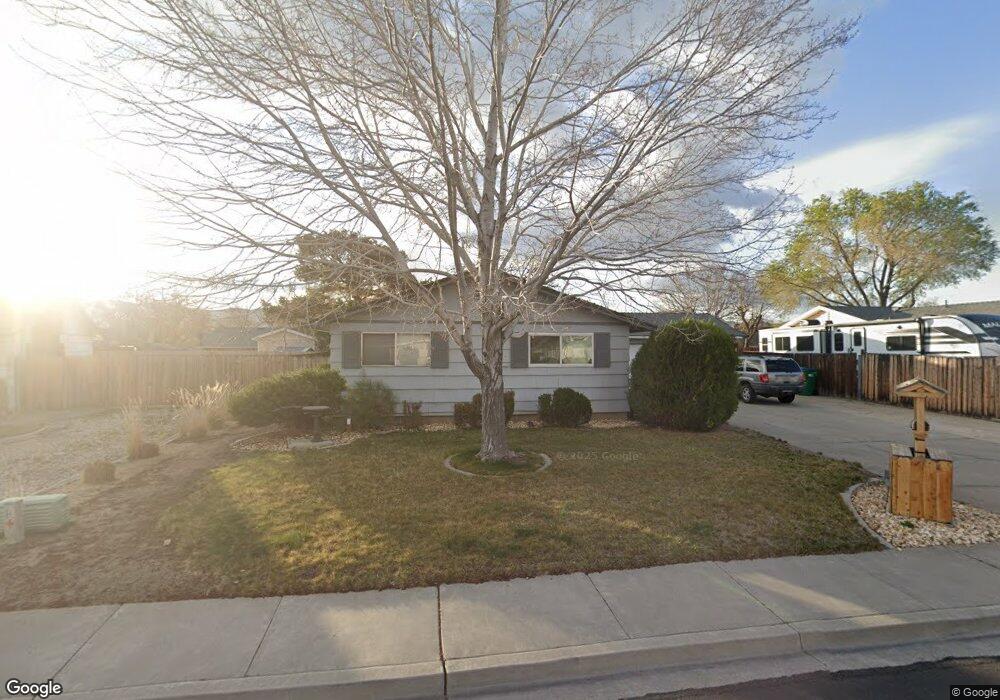
1868 Rizzo Dr Sparks, NV 89434
O'Callaghan NeighborhoodEstimated Value: $419,000 - $440,000
3
Beds
2
Baths
1,333
Sq Ft
$322/Sq Ft
Est. Value
About This Home
This home is located at 1868 Rizzo Dr, Sparks, NV 89434 and is currently estimated at $428,730, approximately $321 per square foot. 1868 Rizzo Dr is a home located in Washoe County with nearby schools including Katherine Dunn Elementary School, George L Dilworth Middle School, and Edward C Reed High School.
Ownership History
Date
Name
Owned For
Owner Type
Purchase Details
Closed on
Aug 11, 2015
Sold by
Salyers Gary E and Salyers Gary E
Bought by
Salyers Gary E
Current Estimated Value
Home Financials for this Owner
Home Financials are based on the most recent Mortgage that was taken out on this home.
Original Mortgage
$103,816
Outstanding Balance
$81,706
Interest Rate
4.05%
Mortgage Type
VA
Estimated Equity
$347,024
Purchase Details
Closed on
Jul 23, 2003
Sold by
Salyers Gary E and Salyers Lorna P
Bought by
Salyers Gary E
Home Financials for this Owner
Home Financials are based on the most recent Mortgage that was taken out on this home.
Original Mortgage
$98,700
Interest Rate
5.17%
Mortgage Type
Unknown
Purchase Details
Closed on
Apr 25, 1996
Sold by
Freshman Daniel J and Freshman Keri E
Bought by
Salyers Gary E
Create a Home Valuation Report for This Property
The Home Valuation Report is an in-depth analysis detailing your home's value as well as a comparison with similar homes in the area
Home Values in the Area
Average Home Value in this Area
Purchase History
| Date | Buyer | Sale Price | Title Company |
|---|---|---|---|
| Salyers Gary E | -- | Western Title Co | |
| Salyers Gary E | -- | Western Title Incorporated | |
| Salyers Gary E | $44,000 | First American Title Co |
Source: Public Records
Mortgage History
| Date | Status | Borrower | Loan Amount |
|---|---|---|---|
| Open | Salyers Gary E | $103,816 | |
| Closed | Salyers Gary E | $98,700 | |
| Closed | Salyers Gary E | $42,800 |
Source: Public Records
Tax History Compared to Growth
Tax History
| Year | Tax Paid | Tax Assessment Tax Assessment Total Assessment is a certain percentage of the fair market value that is determined by local assessors to be the total taxable value of land and additions on the property. | Land | Improvement |
|---|---|---|---|---|
| 2025 | $1,277 | $60,833 | $37,275 | $23,558 |
| 2024 | $1,277 | $55,921 | $32,620 | $23,301 |
| 2023 | $1,120 | $53,282 | $31,710 | $21,572 |
| 2022 | $1,092 | $45,033 | $27,475 | $17,558 |
| 2021 | $1,063 | $39,300 | $21,175 | $18,125 |
| 2020 | $1,028 | $39,256 | $20,510 | $18,746 |
| 2019 | $1,018 | $37,528 | $18,865 | $18,663 |
| 2018 | $972 | $32,158 | $13,405 | $18,753 |
| 2017 | $943 | $32,156 | $12,810 | $19,346 |
| 2016 | $917 | $32,478 | $12,355 | $20,123 |
| 2015 | $916 | $30,030 | $9,695 | $20,335 |
| 2014 | $834 | $26,954 | $8,435 | $18,519 |
| 2013 | -- | $24,694 | $6,055 | $18,639 |
Source: Public Records
Map
Nearby Homes
- 1897 Bonita Vista Dr
- 1973 Rio Tinto Dr
- 1970 Woodhaven Ln
- 1544 Woodhaven Ln
- 1728 Bluehaven Dr
- 913 Glen Molly Dr
- 1051 Glen Martin Dr
- 1218 Junction Dr
- 1990 Fargo Way
- 745 Glen Vista Dr
- 1332 Coachman Ct
- 949 Crestwood Dr Unit 3
- 857 Cherry Tree Dr Unit 3
- 2435 Sycamore Glen Dr Unit 2
- 848 Parkside Dr Unit 1
- 2407 Sunny Slope Dr Unit 1
- 801 Woodglen Dr Unit 2
- 1128 Bradley Square
- 2252 Sycamore Glen Dr
- 370 O'Brien Way
- 1888 Rizzo Dr
- 1867 Bonita Vista Dr
- 1837 Bonita Vista Dr
- 1887 Rizzo Dr
- 1828 Rizzo Dr
- 1917 Bonita Vista Dr
- 1918 Rizzo Dr
- 1827 Bonita Vista Dr
- 1947 Bonita Vista Dr
- 1927 Rizzo Dr
- 1827 Rizzo Ct
- 1827 Rizzo Dr
- 1818 Rizzo Dr
- 1867 Rizzo Dr
- 1813 Bonita Vista Dr
- 1938 Rizzo Dr
- 1987 Bonita Vista Dr
- 1817 Rizzo Dr
- 1836 Bonita Vista Dr
- 1866 Bonita Vista Dr