1868 W Lullaby Ln Anaheim, CA 92804
Hermosa Village NeighborhoodEstimated Value: $948,000 - $1,163,000
5
Beds
2
Baths
1,979
Sq Ft
$534/Sq Ft
Est. Value
About This Home
This home is located at 1868 W Lullaby Ln, Anaheim, CA 92804 and is currently estimated at $1,057,302, approximately $534 per square foot. 1868 W Lullaby Ln is a home located in Orange County with nearby schools including James Madison Elementary School, Ball Junior High School, and Loara High School.
Ownership History
Date
Name
Owned For
Owner Type
Purchase Details
Closed on
Mar 6, 2023
Sold by
Vando Chung Van
Bought by
Do Tin Hung
Current Estimated Value
Purchase Details
Closed on
Nov 4, 2013
Sold by
Mai Thanh
Bought by
Do Linnet
Purchase Details
Closed on
Apr 1, 2009
Sold by
Lam Lan
Bought by
Vanvando Chung Van
Purchase Details
Closed on
Jan 29, 2004
Sold by
Greenberg Norman A
Bought by
Nguyen Ky Ngoc
Home Financials for this Owner
Home Financials are based on the most recent Mortgage that was taken out on this home.
Original Mortgage
$356,250
Interest Rate
5.85%
Mortgage Type
Stand Alone First
Purchase Details
Closed on
Jan 22, 2004
Sold by
Greenberg Ruth B
Bought by
Greenberg Norman A
Home Financials for this Owner
Home Financials are based on the most recent Mortgage that was taken out on this home.
Original Mortgage
$356,250
Interest Rate
5.85%
Mortgage Type
Stand Alone First
Create a Home Valuation Report for This Property
The Home Valuation Report is an in-depth analysis detailing your home's value as well as a comparison with similar homes in the area
Home Values in the Area
Average Home Value in this Area
Purchase History
| Date | Buyer | Sale Price | Title Company |
|---|---|---|---|
| Do Tin Hung | -- | -- | |
| Do Linnet | -- | Nextitle | |
| Vando Chung | -- | Nextitle | |
| Vanvando Chung Van | -- | None Available | |
| Nguyen Ky Ngoc | -- | None Available | |
| Vanvando Chung Van | $17,000 | None Available | |
| Nguyen Ky Ngoc | $475,000 | Lawyers Title Company | |
| Greenberg Norman A | -- | Lawyers Title Company |
Source: Public Records
Mortgage History
| Date | Status | Borrower | Loan Amount |
|---|---|---|---|
| Previous Owner | Nguyen Ky Ngoc | $356,250 |
Source: Public Records
Tax History Compared to Growth
Tax History
| Year | Tax Paid | Tax Assessment Tax Assessment Total Assessment is a certain percentage of the fair market value that is determined by local assessors to be the total taxable value of land and additions on the property. | Land | Improvement |
|---|---|---|---|---|
| 2025 | $5,705 | $493,206 | $354,904 | $138,302 |
| 2024 | $5,705 | $483,536 | $347,945 | $135,591 |
| 2023 | $5,509 | $474,055 | $341,122 | $132,933 |
| 2022 | $5,438 | $464,760 | $334,433 | $130,327 |
| 2021 | $5,447 | $455,648 | $327,876 | $127,772 |
| 2020 | $5,424 | $450,976 | $324,514 | $126,462 |
| 2019 | $5,260 | $442,134 | $318,151 | $123,983 |
| 2018 | $5,150 | $433,465 | $311,913 | $121,552 |
| 2017 | $4,945 | $424,966 | $305,797 | $119,169 |
| 2016 | $4,930 | $416,634 | $299,801 | $116,833 |
| 2015 | $4,886 | $410,376 | $295,297 | $115,079 |
| 2014 | $4,583 | $402,338 | $289,513 | $112,825 |
Source: Public Records
Map
Nearby Homes
- 1944 W Lullaby Ln
- 1700 W Cerritos Ave Unit 216
- 1350 S Ashington Ln
- 2011 W Katella Ave Unit 61
- 1675 W Mells Ln
- 1645 S Euclid St
- 930 S Emerald St
- 1250 S Brookhurst St Unit 1059
- 1250 S Brookhurst St Unit 2028
- 1250 S Brookhurst St Unit 2080
- 1250 S Brookhurst St
- 1250 S Brookhurst St Unit 2033
- 1768 W Juno Ave
- 1737 S Garden Dr
- 1616 S Euclid St Unit 100
- 1616 S Euclid St Unit 75
- 1616 S Euclid St Unit 54
- 1616 S Euclid St Unit 23
- 10622 Tibbs Cir
- 1913 W Beacon Ave
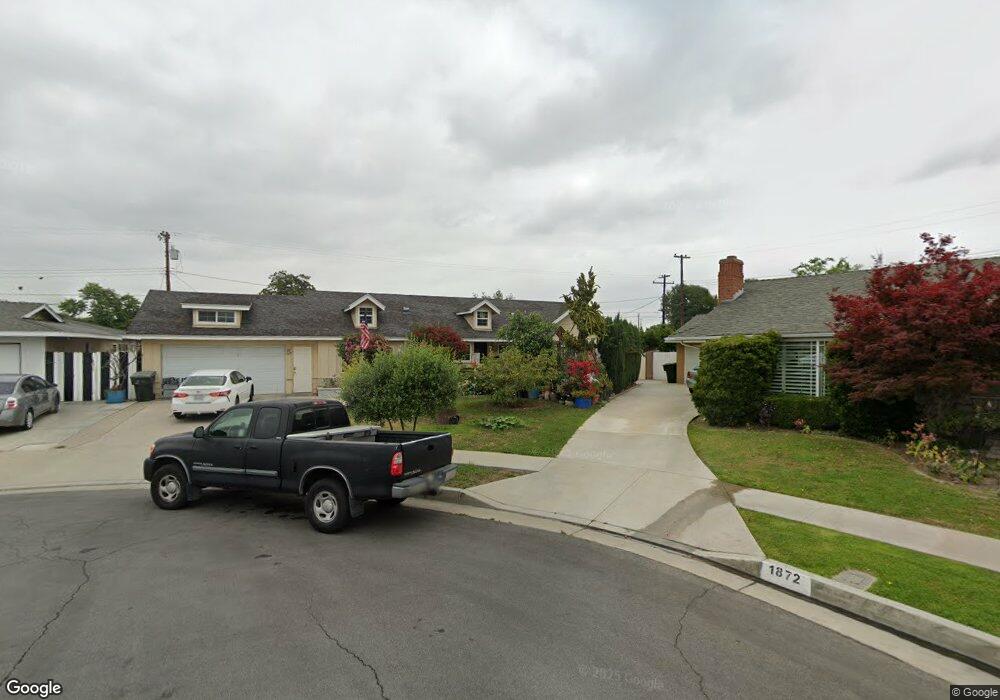
- 1872 W Lullaby Ln
- 1447 S Easy Way
- 1453 S Easy Way
- 1869 W Lullaby Ln
- 1869 W Cerritos Ave
- 1443 S Easy Way
- 1873 W Cerritos Ave
- 1878 W Lullaby Ln
- 1861 W Cerritos Ave
- 1873 W Lullaby Ln
- 1879 W Cerritos Ave
- 1437 S Easy Way
- 1879 W Lullaby Ln
- 1882 W Lullaby Ln
- 1872 W Harriet Ln
- 1448 S Easy Way
- 1883 W Cerritos Ave
- 1883 W Lullaby Ln
- 1868 W Harriet Ln
- 1431 S Easy Way