Estimated Value: $305,000 - $311,435
2
Beds
2
Baths
1,769
Sq Ft
$174/Sq Ft
Est. Value
About This Home
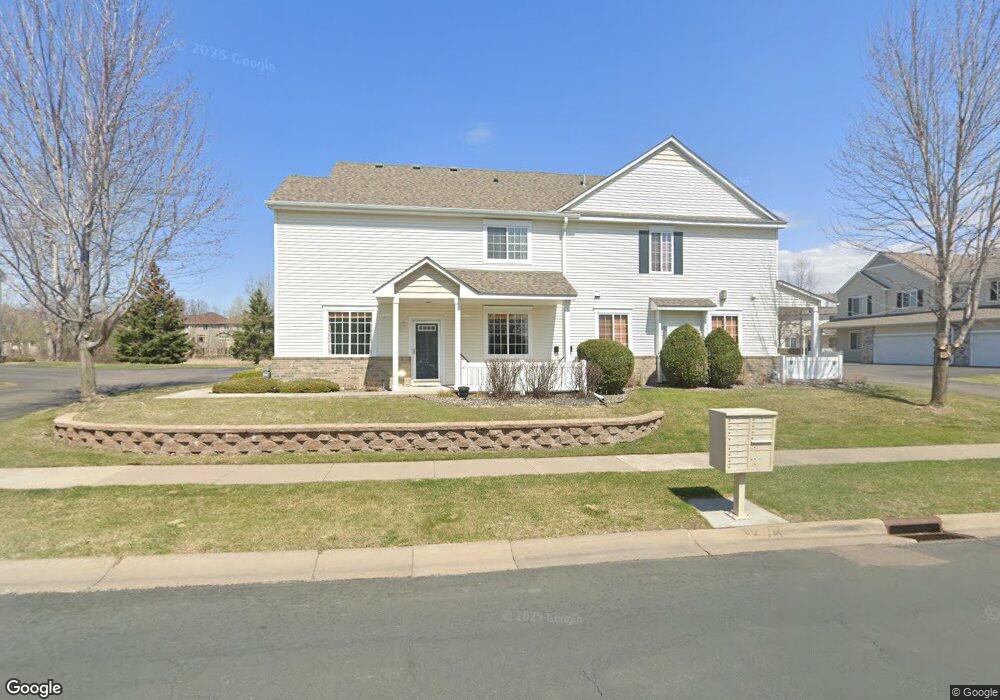
This home is located at 18680 97th Place N, Osseo, MN 55311 and is currently estimated at $307,859, approximately $174 per square foot. 18680 97th Place N is a home located in Hennepin County with nearby schools including Fernbrook Elementary School, Osseo Middle School, and Maple Grove Senior High School.
Ownership History
Date
Name
Owned For
Owner Type
Purchase Details
Closed on
Apr 5, 2023
Sold by
Rahmani Nayra and Rahmani Maiwand
Bought by
Rahmani Nayra and Rahmani Maiwand
Current Estimated Value
Purchase Details
Closed on
Nov 1, 2021
Sold by
Elabbady Mohamed A and Salem Doha
Bought by
Rahmani Nayra
Home Financials for this Owner
Home Financials are based on the most recent Mortgage that was taken out on this home.
Original Mortgage
$229,500
Interest Rate
3.05%
Mortgage Type
New Conventional
Purchase Details
Closed on
Jul 31, 2014
Sold by
Lennartson Anne Anne
Bought by
Elabbady Mohamed Mohamed
Home Financials for this Owner
Home Financials are based on the most recent Mortgage that was taken out on this home.
Original Mortgage
$179,000
Interest Rate
4.12%
Purchase Details
Closed on
Dec 21, 2004
Sold by
Centex Homes Minnesota Division
Bought by
Schmidt Jeremy and Mickelson Anne
Create a Home Valuation Report for This Property
The Home Valuation Report is an in-depth analysis detailing your home's value as well as a comparison with similar homes in the area
Home Values in the Area
Average Home Value in this Area
Purchase History
| Date | Buyer | Sale Price | Title Company |
|---|---|---|---|
| Rahmani Nayra | $500 | Lake Title | |
| Rahmani Nayra | $270,000 | Gcs Title | |
| Elabbady Mohamed Mohamed | $180,000 | -- | |
| Schmidt Jeremy | $214,470 | -- |
Source: Public Records
Mortgage History
| Date | Status | Borrower | Loan Amount |
|---|---|---|---|
| Previous Owner | Rahmani Nayra | $229,500 | |
| Previous Owner | Elabbady Mohamed Mohamed | $179,000 |
Source: Public Records
Tax History Compared to Growth
Tax History
| Year | Tax Paid | Tax Assessment Tax Assessment Total Assessment is a certain percentage of the fair market value that is determined by local assessors to be the total taxable value of land and additions on the property. | Land | Improvement |
|---|---|---|---|---|
| 2024 | $3,402 | $295,700 | $67,100 | $228,600 |
| 2023 | $3,356 | $294,500 | $66,500 | $228,000 |
| 2022 | $2,954 | $294,600 | $54,300 | $240,300 |
| 2021 | $2,782 | $255,200 | $44,600 | $210,600 |
| 2020 | $2,744 | $238,200 | $37,200 | $201,000 |
| 2019 | $2,586 | $224,800 | $40,500 | $184,300 |
| 2018 | $2,575 | $203,000 | $32,700 | $170,300 |
| 2017 | $2,450 | $184,100 | $40,000 | $144,100 |
| 2016 | $2,423 | $180,200 | $42,000 | $138,200 |
| 2015 | $2,465 | $178,500 | $49,500 | $129,000 |
| 2014 | -- | $165,700 | $51,000 | $114,700 |
Source: Public Records
Map
Nearby Homes
- 9803 Vagabond Ln N
- 18502 97th Place N Unit 2204
- 9872 Alvarado Ln N Unit 4803
- 10056 Walnut Grove Ln N
- 19086 100th Place N
- 9365 Tewsbury Bend
- 18080 100th Ct N
- 19188 101st Place
- 19077 101st Place
- 17868 96th Ave N
- 18050 100th Ct N
- 9363 Tewsbury Gate N
- 17913 96th Ave N
- 10148 Shadyview Ln N
- 10261 Shadyview Ln N
- 10184 Queensland Ln N
- 9601 Olive Ln N
- 10275 Shadyview N
- 18336 103rd Cir N
- 18250 102nd Place N
- 18652 97th Place N
- 18652 97th Place N Unit 903
- 18650 97th Place N
- 18682 97th Place N
- 18650 97th Place N
- 18680 18680 97th Place N
- 18652 18652 97th Place N
- 18682 18682 97th Place N
- 18682 18682 97th-Place-n
- 18693 18693 97th-Place-n
- 18692 97th Place N
- 18640 97th Place N
- 18631 18631 97th-Place-n
- 18653 18653 97th-Place-n
- 18600 97th Place N
- 18642 97th Place N
- 18642 97th Place N
- 18642 97th Place N
- 18600 97th Place N
- 18700 97th Place N