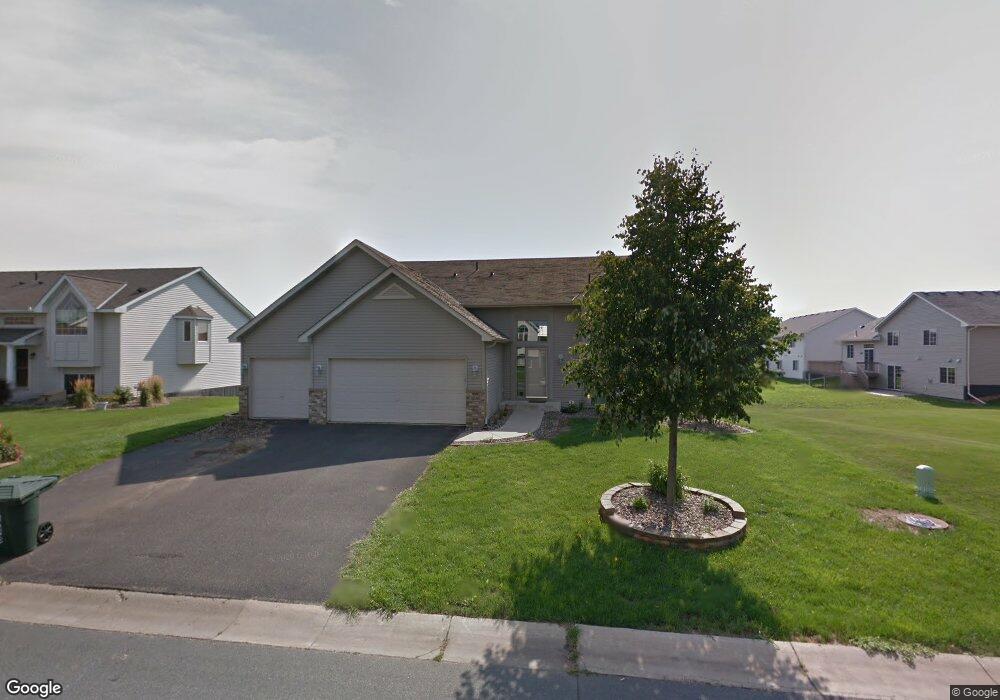
18688 Dylan Dr Farmington, MN 55024
Estimated Value: $431,000 - $446,000
4
Beds
2
Baths
1,394
Sq Ft
$316/Sq Ft
Est. Value
About This Home
This home is located at 18688 Dylan Dr, Farmington, MN 55024 and is currently estimated at $440,265, approximately $315 per square foot. 18688 Dylan Dr is a home located in Dakota County with nearby schools including Akin Road Elementary School, Levi P. Dodge Middle School, and Farmington High School.
Ownership History
Date
Name
Owned For
Owner Type
Purchase Details
Closed on
Apr 21, 2017
Sold by
Okonek Bradley T and Okonek Natalie M
Bought by
Apold Megan R and Rose Ryan D
Current Estimated Value
Home Financials for this Owner
Home Financials are based on the most recent Mortgage that was taken out on this home.
Original Mortgage
$271,700
Outstanding Balance
$226,095
Interest Rate
4.21%
Mortgage Type
New Conventional
Estimated Equity
$214,170
Purchase Details
Closed on
Oct 15, 2009
Sold by
Brentzel Brian A and Walker Lynn A
Bought by
Okonek Bradley T and Drennen Natalie M
Purchase Details
Closed on
Nov 17, 2006
Sold by
Dixon Mark C and Dixon Juli M
Bought by
Brentzel Brian A and Walker Lynn A
Purchase Details
Closed on
Apr 29, 2004
Sold by
Davis Erik L and Davis Jennifer A
Bought by
Dixon Mark C and Dixon Juli M
Purchase Details
Closed on
May 30, 2003
Sold by
Mesa Properties Inc
Bought by
Key-Land Homes
Purchase Details
Closed on
Dec 23, 2002
Sold by
Progress Land Company Inc
Bought by
Mesa Properties Inc
Create a Home Valuation Report for This Property
The Home Valuation Report is an in-depth analysis detailing your home's value as well as a comparison with similar homes in the area
Home Values in the Area
Average Home Value in this Area
Purchase History
| Date | Buyer | Sale Price | Title Company |
|---|---|---|---|
| Apold Megan R | $286,000 | Partners Title Llc | |
| Okonek Bradley T | $230,000 | -- | |
| Brentzel Brian A | $274,000 | -- | |
| Dixon Mark C | $264,000 | -- | |
| Key-Land Homes | $57,075 | -- | |
| Davis Eric L | $205,697 | -- | |
| Mesa Properties Inc | $2,126,000 | -- |
Source: Public Records
Mortgage History
| Date | Status | Borrower | Loan Amount |
|---|---|---|---|
| Open | Apold Megan R | $271,700 | |
| Closed | Okonek Bradley T | $0 |
Source: Public Records
Tax History Compared to Growth
Tax History
| Year | Tax Paid | Tax Assessment Tax Assessment Total Assessment is a certain percentage of the fair market value that is determined by local assessors to be the total taxable value of land and additions on the property. | Land | Improvement |
|---|---|---|---|---|
| 2024 | $5,252 | $412,700 | $112,600 | $300,100 |
| 2023 | $5,252 | $431,200 | $112,800 | $318,400 |
| 2022 | $4,956 | $410,400 | $112,500 | $297,900 |
| 2021 | $4,768 | $352,100 | $97,800 | $254,300 |
| 2020 | $4,366 | $337,300 | $93,200 | $244,100 |
| 2019 | $4,996 | $300,000 | $88,700 | $211,300 |
| 2018 | $4,622 | $332,700 | $83,900 | $248,800 |
| 2017 | $4,504 | $301,000 | $79,900 | $221,100 |
| 2016 | $4,465 | $286,200 | $76,000 | $210,200 |
| 2015 | $4,048 | $264,036 | $70,212 | $193,824 |
| 2014 | -- | $252,264 | $64,966 | $187,298 |
| 2013 | -- | $221,526 | $57,388 | $164,138 |
Source: Public Records
Map
Nearby Homes
- 18681 Dulaney Dr
- 4876 191st St W
- 18285 Dunbury Ave
- 5412 188th St W
- 4750 190th St W
- 18372 English Ave
- 18231 Elkwood Ave
- 18840 Enhance Ct
- 19055 Enchanted Way
- 19320 Ellington Trail
- 18400 Euclid St Unit 362
- 19110 Euclid Path
- 17895 Eclipse Ave
- 18325 Euclid St
- 18307 Euclid St
- 19145 Euclid Path
- 5695 Lower 182nd St W
- 19500 Blue Jay Ct
- 18635 Explorer Way
- 5509 Oriole Dr Unit 10
- 18676 Dylan Dr
- 4889 187th St W
- 4883 187th St W
- 4883 4883 187th-Street-w
- 18664 Dylan Dr
- 4877 187th St W
- 18685 Dylan Dr
- 18691 Dylan Dr
- 18652 Dylan Dr
- 18677 Dylan Dr
- 4869 187th St W
- 18699 Dylan Dr
- 18700 Dylan Dr
- 4863 187th St W
- 18703 Dupont Way
- 18650 Easton Ave
- 18661 Dylan Dr
- 18646 Easton Ave
- 18701 Dylan Dr
- 18655 Dylan Dr