Estimated Value: $389,420 - $443,000
3
Beds
2
Baths
1,320
Sq Ft
$321/Sq Ft
Est. Value
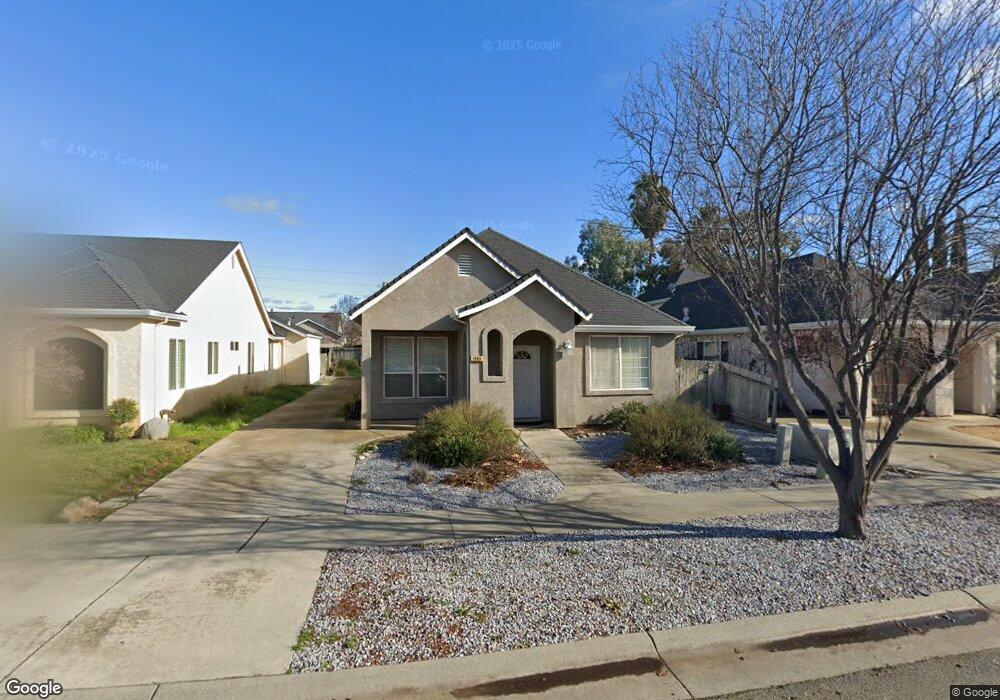
About This Home
This home is located at 1869 Devonshire Dr, Chico, CA 95928 and is currently estimated at $423,605, approximately $320 per square foot. 1869 Devonshire Dr is a home located in Butte County with nearby schools including Little Chico Creek Elementary School, Harry M. Marsh Junior High School, and Chico High School.
Ownership History
Date
Name
Owned For
Owner Type
Purchase Details
Closed on
Jun 16, 2011
Sold by
Needham Asa V
Bought by
Needham Geraldine M
Current Estimated Value
Purchase Details
Closed on
Nov 3, 2007
Sold by
Friend Robert W and Friend Ritva Shanta
Bought by
Friend Robert W and Friend Ritva Shanta
Purchase Details
Closed on
Jul 26, 2004
Sold by
Chevrier Cynthia J and Chevrier Jean
Bought by
Friend Robert W
Home Financials for this Owner
Home Financials are based on the most recent Mortgage that was taken out on this home.
Original Mortgage
$210,000
Interest Rate
1.62%
Mortgage Type
New Conventional
Purchase Details
Closed on
Mar 7, 2002
Sold by
Ashby Clifford T and Ashby Elaine L
Bought by
Chevrier Jean and Chevrier Cynthia J
Home Financials for this Owner
Home Financials are based on the most recent Mortgage that was taken out on this home.
Original Mortgage
$140,950
Interest Rate
6.85%
Create a Home Valuation Report for This Property
The Home Valuation Report is an in-depth analysis detailing your home's value as well as a comparison with similar homes in the area
Purchase History
| Date | Buyer | Sale Price | Title Company |
|---|---|---|---|
| Needham Geraldine M | -- | Mid Valley Title & Escrow Co | |
| Needham Geraldine M | $184,000 | Mid Valley Title & Escrow Co | |
| Friend Robert W | -- | None Available | |
| Friend Robert W | $265,000 | Mid Valley Title & Escrow Co | |
| Chevrier Jean | $148,500 | Bidwell Title & Escrow Compa |
Source: Public Records
Mortgage History
| Date | Status | Borrower | Loan Amount |
|---|---|---|---|
| Previous Owner | Friend Robert W | $210,000 | |
| Previous Owner | Chevrier Jean | $140,950 |
Source: Public Records
Tax History
| Year | Tax Paid | Tax Assessment Tax Assessment Total Assessment is a certain percentage of the fair market value that is determined by local assessors to be the total taxable value of land and additions on the property. | Land | Improvement |
|---|---|---|---|---|
| 2025 | $2,958 | $235,724 | $102,487 | $133,237 |
| 2024 | $2,958 | $231,103 | $100,478 | $130,625 |
| 2023 | $2,852 | $226,572 | $98,508 | $128,064 |
| 2022 | $2,771 | $222,130 | $96,577 | $125,553 |
| 2021 | $2,721 | $217,776 | $94,684 | $123,092 |
| 2020 | $2,681 | $215,544 | $93,714 | $121,830 |
| 2019 | $2,629 | $211,319 | $91,877 | $119,442 |
| 2018 | $2,491 | $207,176 | $90,076 | $117,100 |
| 2017 | $2,548 | $203,114 | $88,310 | $114,804 |
| 2016 | $2,415 | $199,132 | $86,579 | $112,553 |
| 2015 | $2,395 | $196,142 | $85,279 | $110,863 |
| 2014 | $2,420 | $192,301 | $83,609 | $108,692 |
Source: Public Records
Map
Nearby Homes
- 1813 Devonshire Dr
- 2099 Hartford Dr Unit 6
- 2050 Springfield Dr Unit 212
- 2050 Springfield Dr Unit 323
- 1802 Notre Dame Blvd
- 2055 Amanda Way Unit 26
- 8 Shari Ln
- 1991 Humboldt Rd
- 1981 Bending Oak Way
- 2251 Notre Dame Blvd
- 12 Wrangler Ct
- 1810 Roth St
- 2375 Notre Dame Blvd Unit 9
- 2375 Notre Dame Blvd Unit 1
- 1 Casa Del Lago Unit 27
- 1988 Poppy View Terrace
- 825 El Monte Ave
- 17 Sierra Lakeside Ln Unit 32
- 5 Valley Lake Commons
- 26 Sierra Lakeside Ln
- 1873 Devonshire Dr
- 1865 Devonshire Dr
- 1877 Devonshire Dr
- 1861 Devonshire Dr
- 1870 Bedford Dr
- 1866 Bedford Dr
- 1874 Bedford Dr
- 1881 Devonshire Dr
- 1857 Devonshire Dr
- 1862 Bedford Dr
- 1878 Bedford Dr
- 1868 Devonshire Dr
- 1872 Devonshire Dr
- 1864 Devonshire Dr
- 1885 Devonshire Dr
- 1853 Devonshire Dr
- 1876 Devonshire Dr
- 1858 Bedford Dr
- 1882 Bedford Dr
- 1860 Devonshire Dr
Your Personal Tour Guide
Ask me questions while you tour the home.