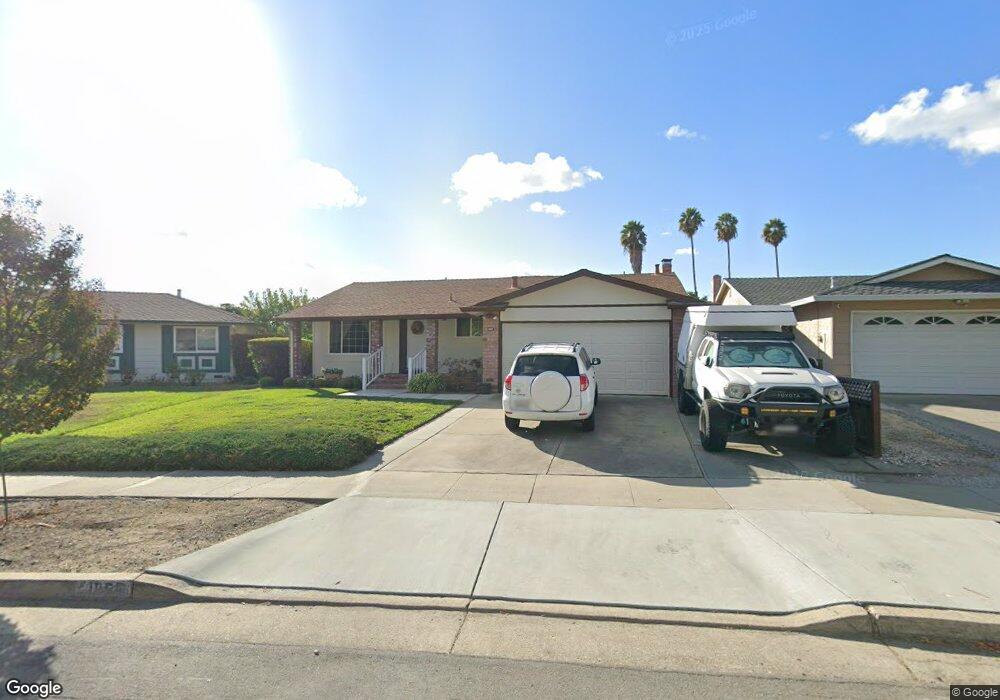
1869 Half Pence Way San Jose, CA 95132
Majestic NeighborhoodEstimated Value: $1,546,559 - $1,669,000
3
Beds
2
Baths
1,372
Sq Ft
$1,180/Sq Ft
Est. Value
About This Home
This home is located at 1869 Half Pence Way, San Jose, CA 95132 and is currently estimated at $1,619,390, approximately $1,180 per square foot. 1869 Half Pence Way is a home located in Santa Clara County with nearby schools including Majestic Way Elementary School, Sierramont Middle School, and Piedmont Hills High School.
Ownership History
Date
Name
Owned For
Owner Type
Purchase Details
Closed on
Dec 2, 2005
Sold by
Ho Lu Lu
Bought by
Ho Edward and Ho Lu Lu
Current Estimated Value
Home Financials for this Owner
Home Financials are based on the most recent Mortgage that was taken out on this home.
Original Mortgage
$150,000
Outstanding Balance
$84,225
Interest Rate
6.35%
Mortgage Type
Credit Line Revolving
Estimated Equity
$1,535,165
Purchase Details
Closed on
May 26, 2004
Sold by
Jones Joanna C
Bought by
Ho Lu Lu
Home Financials for this Owner
Home Financials are based on the most recent Mortgage that was taken out on this home.
Original Mortgage
$308,000
Interest Rate
3.82%
Mortgage Type
Purchase Money Mortgage
Purchase Details
Closed on
Nov 22, 1993
Sold by
Jones Joanna C and Osteen Kenneth D
Bought by
Jones Joanna C
Home Financials for this Owner
Home Financials are based on the most recent Mortgage that was taken out on this home.
Original Mortgage
$120,000
Interest Rate
7.09%
Create a Home Valuation Report for This Property
The Home Valuation Report is an in-depth analysis detailing your home's value as well as a comparison with similar homes in the area
Home Values in the Area
Average Home Value in this Area
Purchase History
| Date | Buyer | Sale Price | Title Company |
|---|---|---|---|
| Ho Edward | $330,000 | Stewart Title Of California | |
| Ho Lu Lu | $440,000 | Fidelity National Title Ins | |
| Jones Joanna C | -- | North American Title Co Inc |
Source: Public Records
Mortgage History
| Date | Status | Borrower | Loan Amount |
|---|---|---|---|
| Open | Ho Edward | $150,000 | |
| Previous Owner | Ho Lu Lu | $308,000 | |
| Previous Owner | Jones Joanna C | $120,000 |
Source: Public Records
Tax History Compared to Growth
Tax History
| Year | Tax Paid | Tax Assessment Tax Assessment Total Assessment is a certain percentage of the fair market value that is determined by local assessors to be the total taxable value of land and additions on the property. | Land | Improvement |
|---|---|---|---|---|
| 2025 | $9,118 | $625,570 | $375,343 | $250,227 |
| 2024 | $9,118 | $613,305 | $367,984 | $245,321 |
| 2023 | $8,944 | $601,280 | $360,769 | $240,511 |
| 2022 | $8,904 | $589,492 | $353,696 | $235,796 |
| 2021 | $8,605 | $577,934 | $346,761 | $231,173 |
| 2020 | $8,331 | $572,009 | $343,206 | $228,803 |
| 2019 | $8,009 | $560,794 | $336,477 | $224,317 |
| 2018 | $7,890 | $549,799 | $329,880 | $219,919 |
| 2017 | $7,931 | $539,019 | $323,412 | $215,607 |
| 2016 | $7,596 | $528,451 | $317,071 | $211,380 |
| 2015 | $7,505 | $520,514 | $312,309 | $208,205 |
| 2014 | $6,919 | $510,319 | $306,192 | $204,127 |
Source: Public Records
Map
Nearby Homes
- 3437 Duchess Ct
- 3453 Trafalgar Place
- 3211 Parkhaven Dr
- 1545 Stone Creek Dr
- 3555 Laurant Way
- 3252 Cropley Ave
- 3070 Ironside Ct
- 3248 Woody Ln
- 2844 Parkrow Ln
- 3093 Melchester Dr
- 1500 Hemmingway Rd
- 3574 Sweigert Rd
- 2085 Ashwood Ln
- 3108 Kermath Dr
- 1398 Vance Dr
- 1756 Valhalla Ct
- 3139 Laneview Dr
- 2327 Farmcrest St
- 3513 Ivalynn Cir
- 3190 Vesuvius Ln
- 1875 Half Pence Way
- 1863 Half Pence Way
- 1876 Majestic Way
- 1884 Majestic Way
- 1881 Half Pence Way
- 1857 Half Pence Way
- 1894 Majestic Way
- 1866 Majestic Way
- 1866 Half Pence Way
- 1902 Majestic Way
- 1858 Majestic Way
- 1887 Half Pence Way
- 1851 Half Pence Way
- 1880 Half Pence Way
- 1912 Majestic Way
- 1854 Half Pence Way
- 1848 Majestic Way
- 1893 Half Pence Way
- 1920 Majestic Way
- 1845 Half Pence Way