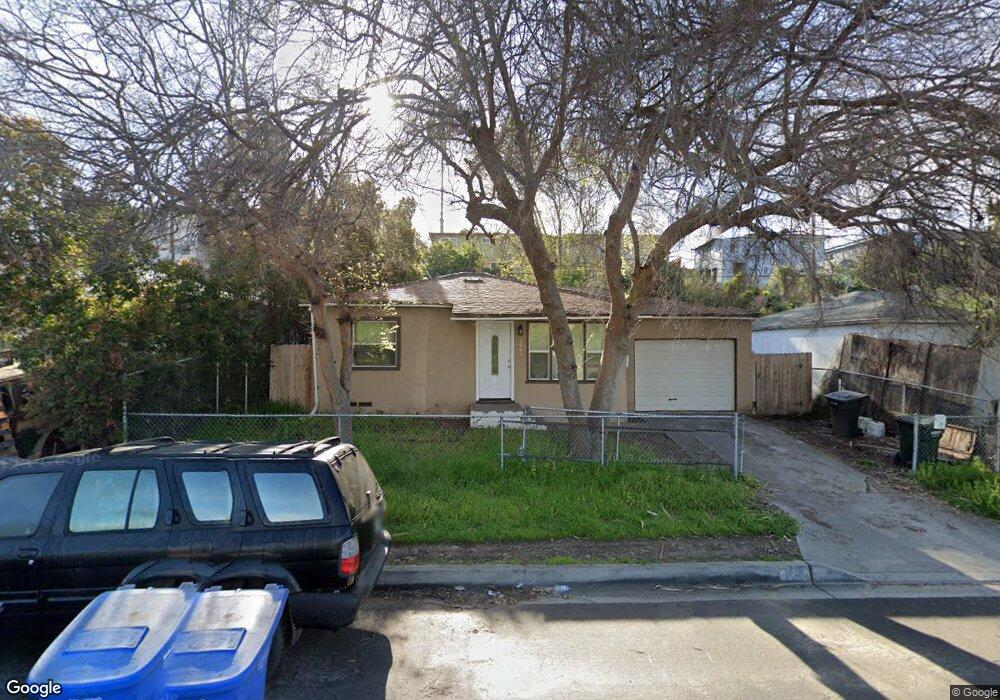
1869 Lemon Grove Ave Lemon Grove, CA 91945
Estimated Value: $601,008 - $665,000
2
Beds
1
Bath
728
Sq Ft
$865/Sq Ft
Est. Value
About This Home
This home is located at 1869 Lemon Grove Ave, Lemon Grove, CA 91945 and is currently estimated at $630,002, approximately $865 per square foot. 1869 Lemon Grove Ave is a home located in San Diego County with nearby schools including Monterey Heights Elementary, Mount Miguel High School, and Keiller Leadership Academy.
Ownership History
Date
Name
Owned For
Owner Type
Purchase Details
Closed on
May 17, 2013
Sold by
Jessee Construction Inc
Bought by
Flores Oscar
Current Estimated Value
Home Financials for this Owner
Home Financials are based on the most recent Mortgage that was taken out on this home.
Original Mortgage
$257,400
Outstanding Balance
$181,492
Interest Rate
3.37%
Mortgage Type
VA
Estimated Equity
$448,510
Purchase Details
Closed on
Mar 18, 2013
Sold by
Haddock Elvira
Bought by
Haddock Ii John D
Home Financials for this Owner
Home Financials are based on the most recent Mortgage that was taken out on this home.
Original Mortgage
$257,400
Outstanding Balance
$181,492
Interest Rate
3.37%
Mortgage Type
VA
Estimated Equity
$448,510
Purchase Details
Closed on
Mar 11, 2013
Sold by
Haddock John D
Bought by
Jessee Construction Inc
Create a Home Valuation Report for This Property
The Home Valuation Report is an in-depth analysis detailing your home's value as well as a comparison with similar homes in the area
Home Values in the Area
Average Home Value in this Area
Purchase History
| Date | Buyer | Sale Price | Title Company |
|---|---|---|---|
| Flores Oscar | $252,000 | Ticor Title San Diego Branch | |
| Flores Oscar | -- | Ticor Title San Diego Branch | |
| Haddock Ii John D | -- | Ticor Title | |
| Jessee Construction Inc | $120,000 | Ticor Title |
Source: Public Records
Mortgage History
| Date | Status | Borrower | Loan Amount |
|---|---|---|---|
| Open | Flores Oscar | $257,400 |
Source: Public Records
Tax History Compared to Growth
Tax History
| Year | Tax Paid | Tax Assessment Tax Assessment Total Assessment is a certain percentage of the fair market value that is determined by local assessors to be the total taxable value of land and additions on the property. | Land | Improvement |
|---|---|---|---|---|
| 2025 | $4,335 | $310,311 | $123,138 | $187,173 |
| 2024 | $4,335 | $304,227 | $120,724 | $183,503 |
| 2023 | $4,230 | $298,262 | $118,357 | $179,905 |
| 2022 | $4,209 | $292,415 | $116,037 | $176,378 |
| 2021 | $4,156 | $286,682 | $113,762 | $172,920 |
| 2020 | $4,106 | $283,743 | $112,596 | $171,147 |
| 2019 | $4,040 | $278,181 | $110,389 | $167,792 |
| 2018 | $3,950 | $272,727 | $108,225 | $164,502 |
| 2017 | $150 | $267,380 | $106,103 | $161,277 |
| 2016 | $3,751 | $262,138 | $104,023 | $158,115 |
| 2015 | $3,730 | $258,201 | $102,461 | $155,740 |
| 2014 | $3,588 | $253,144 | $100,454 | $152,690 |
Source: Public Records
Map
Nearby Homes
- 1928 Noble St
- 1795 Lemon Grove Ave
- 2108 El Prado Ave
- 2240-42 El Prado Ave
- 2030 Fairhaven St
- 1607 Watwood Rd
- 1701 Dayton Dr
- 1737-41 Glencoe Dr
- 1942 Madera St
- 2127 Berry St
- 1915 Englewood Dr
- 7083 Berry Park Ln
- 7065 Berry Park Ln
- 1015 Harlan Cir
- 2674 Buena Vista Ave
- 0 Dartmoor Dr Unit 1
- 1062 Armacost Rd
- 7015 Lermas Ct
- 8046-48 Sarawak Dr
- 2673 Massachusetts Ave
- 1883 Lemon Grove Ave
- 1859 Lemon Grove Ave
- 1852 Noble St
- 1905 Lemon Grove Ave
- 1868 Noble St
- 1846 Noble St
- 1830 Noble St
- 1837 Lemon Grove Ave
- 1882 Noble St
- 1915 Lemon Grove Ave
- 1816 Noble St Unit 18
- 1896 Noble St
- 1925 Lemon Grove Ave
- 1819 Lemon Grove Ave
- 1804 Eldora St
- 1904 Noble St Unit 6
- 1810 Eldora St
- 1939 Lemon Grove Ave
- 1786 Eldora St
- 1918 Noble St